How to Navigate the Chart View of a Dashboard Report
The Reports in My Dashboard include insights and metrics to enable evidence-based decision making to improve your operations. The Chart View of reports provides a visually driven presentation of report data for your review.
Before getting started, make sure:
- You are logged in to SnapTracker.
- You have been assigned access to one report at minimum.
- You have been assigned Menu Access to My Dashboard.
- The correct Customer is selected from the Customer selection list.
This post outlines how to use the Chart view of the My Dashboard reports.
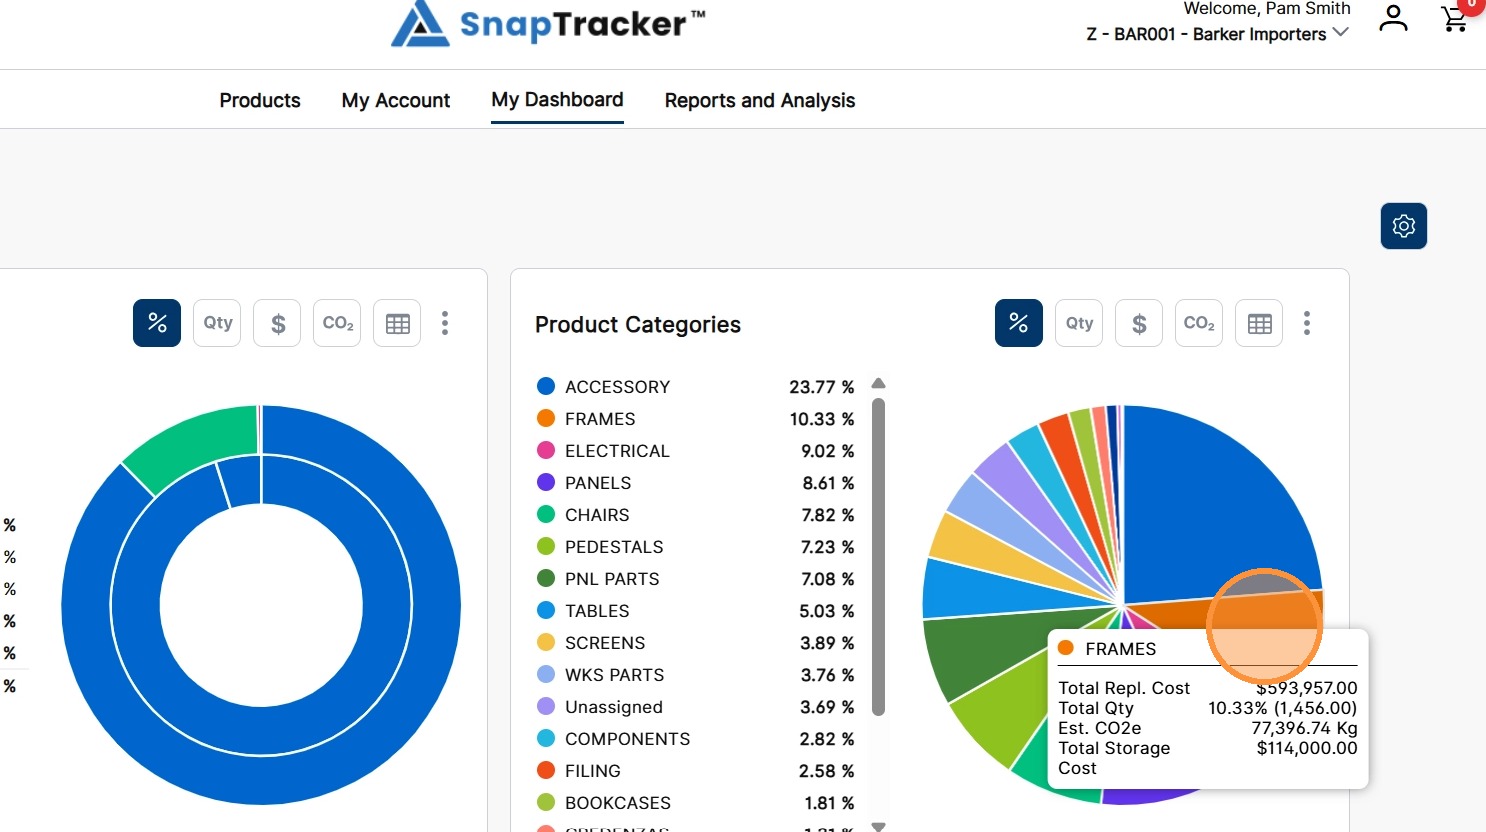
1. To display a tooltip of key metrics, hover your cursor on a segment in Chart View.
The tooltip displays with a summary of information related to the selected section.
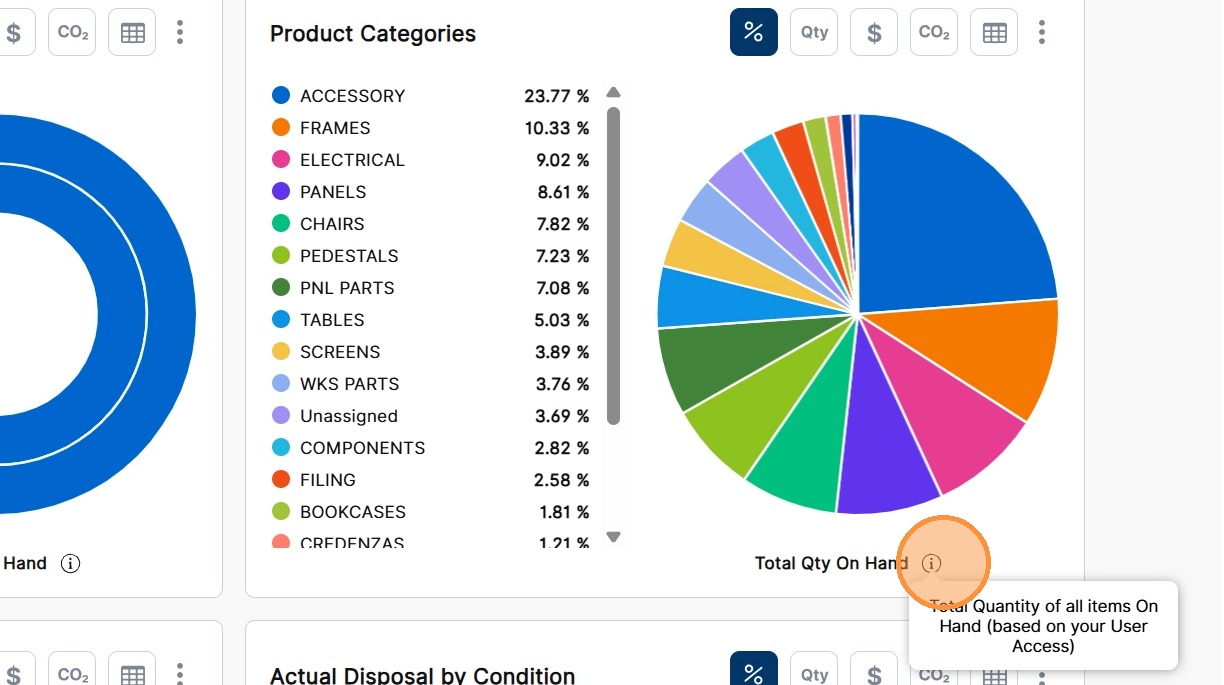
2. To view more information about a field, hover on ‘i’ icons.
A tooltip displays defining the field.
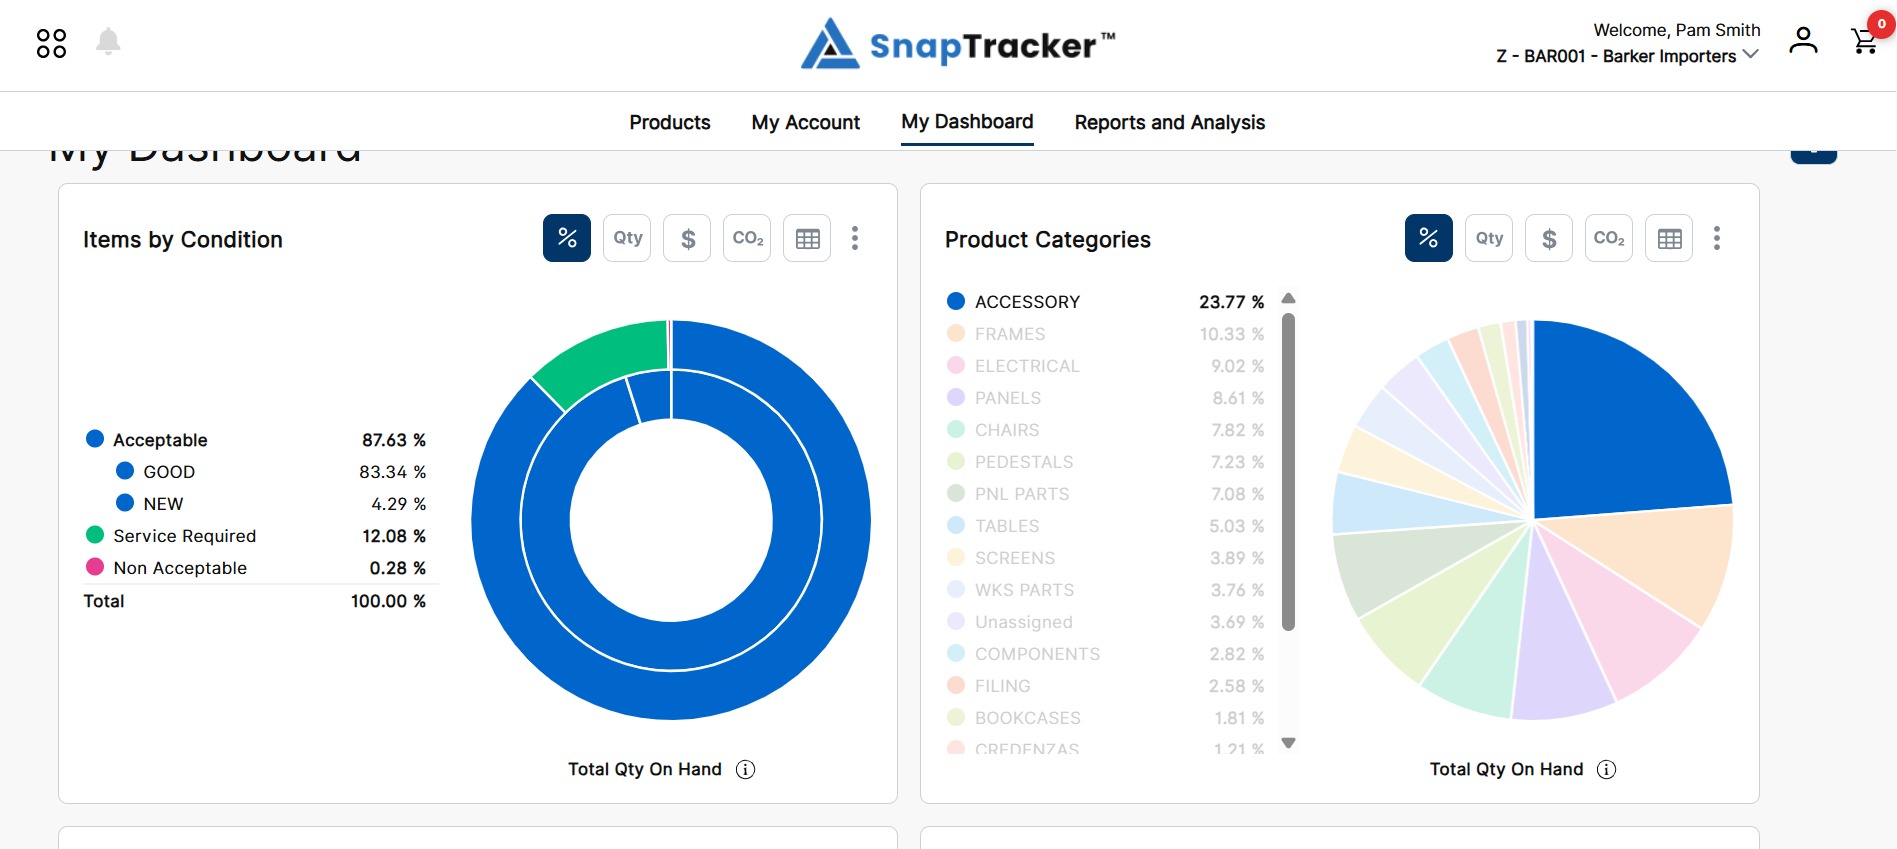
3. To highlight the section in the report, click the segment.
The selected section is highlighted.
Note: To deselect the highlighted section, click the segment again.
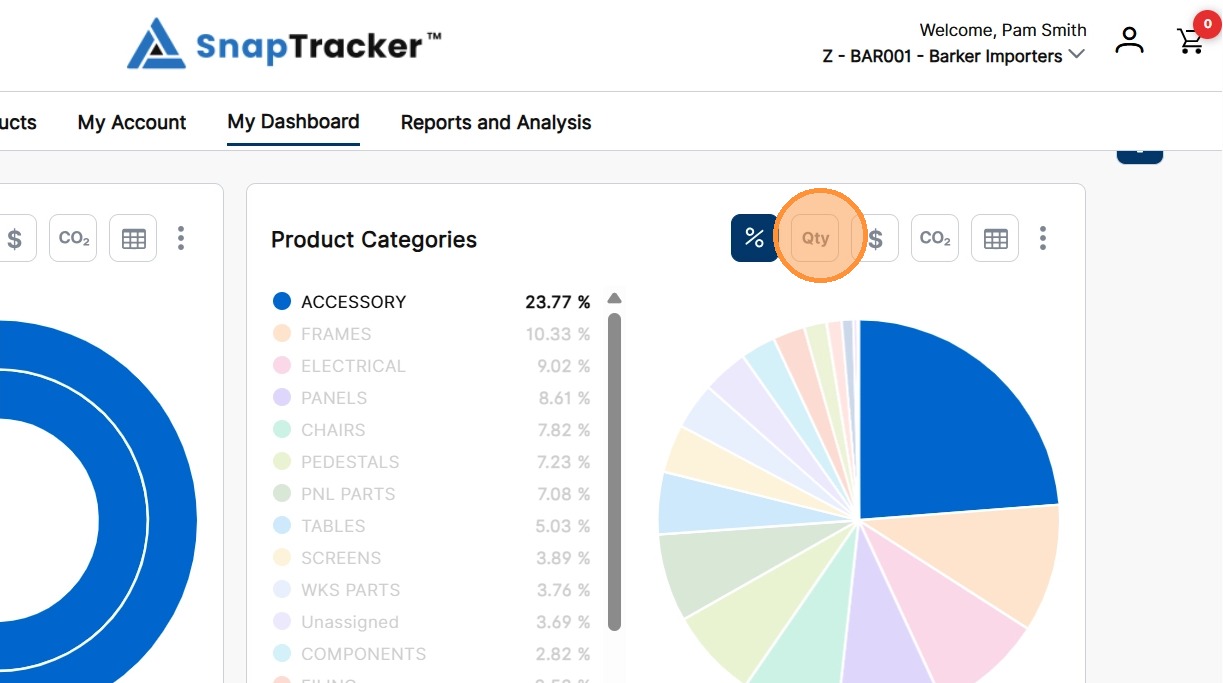
4. To switch the primary metrics displayed to another view, click any toggle icon above the graph.
Different views may include the following views:
- % – Percentage distribution, based on Quantity.
- Qty – Total units of product.
- $ – Total Replacement cost.
- CO2 – The potential CO2e footprint savings if all items are redeployed from inventory.
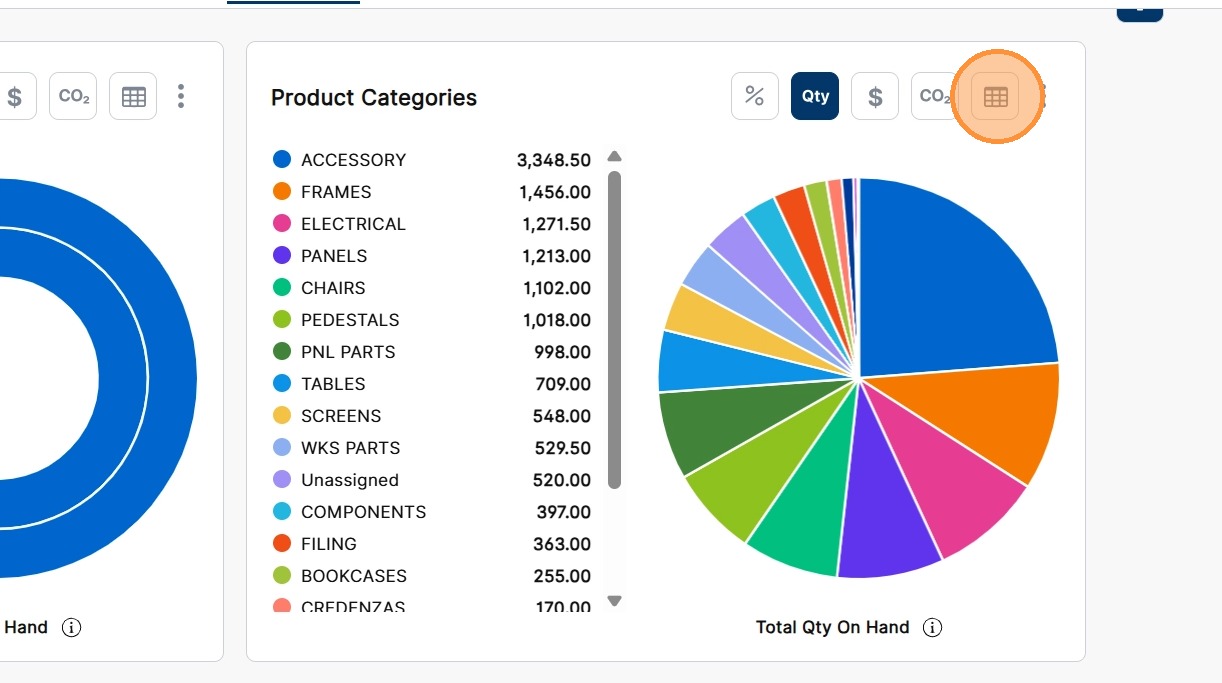
- Table view – View the graph in a table format.
Note: Toggle views may be different for each Report.
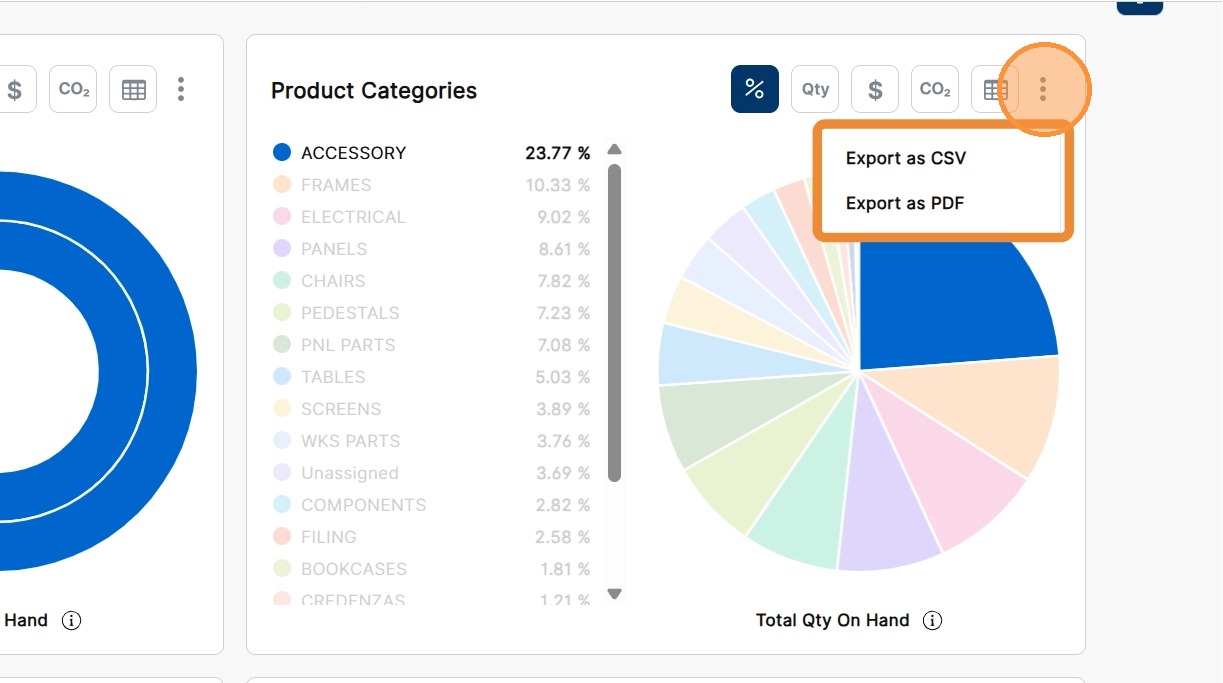
5. To initiate/view export options (CSV or PDF), click the ellipses icon.
6. To open the Table View of the report, click the Table icon.
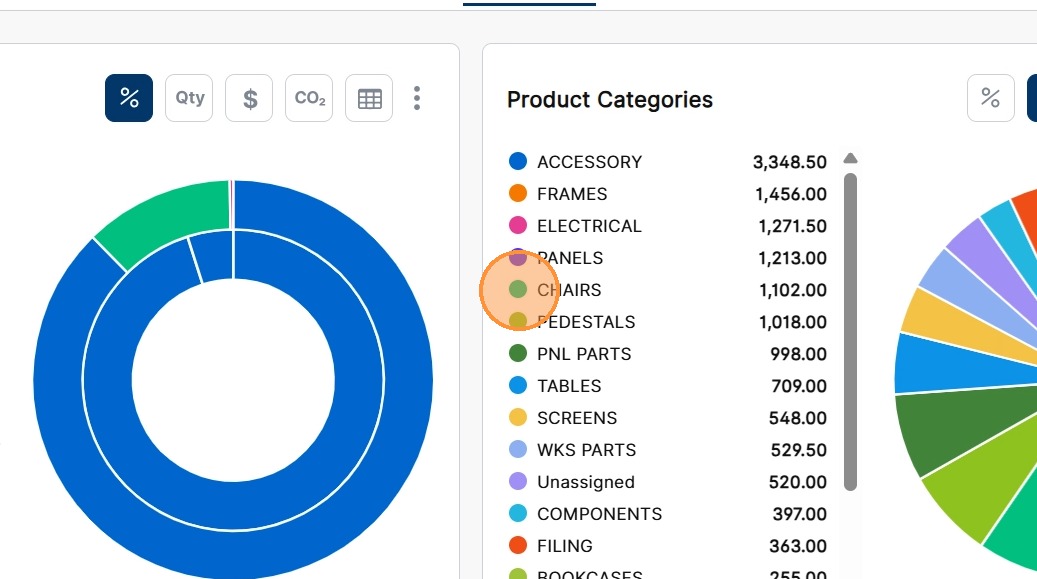
7. To view additional levels in the report, click the drill down action for the report.
Note: The drill down action may be different in the Chart View for each report. It is always in the legend. It may be the series indicator or the series name.
8. When available, you have the option to filter categories by clicking the Filter icon, then click a filter category.
Filter Categories may include:
- Filter By Building – Select the specific Building you would like to see the product in.
- Filter By Building Type – Select the type of Building you would like to see product in. Building Type organizes buildings with similar functions. For example, warehouses may be grouped under one Building Type, onsite buildings as a second Building Type and client-owned warehouses as a third building type.
- Filter By Manufacturer – Select the specific Manufacturer you would like to see products for.
- Filter By Standard Class – Select the specific category you would like to see products for. (Examples of Standard Classes may include Chairs, Storage and Accessories).
- Filter By State – Select the State a Building is in to filter the results by State. State is a field that can be entered for each Building in SnapTracker.
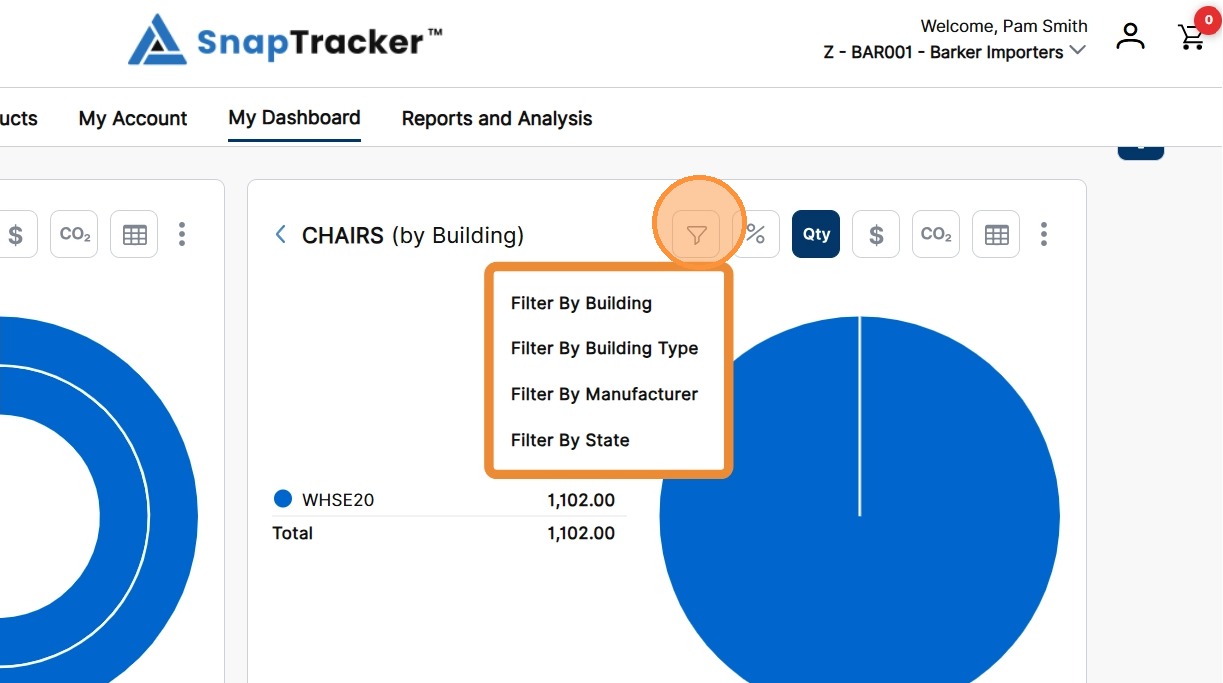
The Filter pop-up displays.
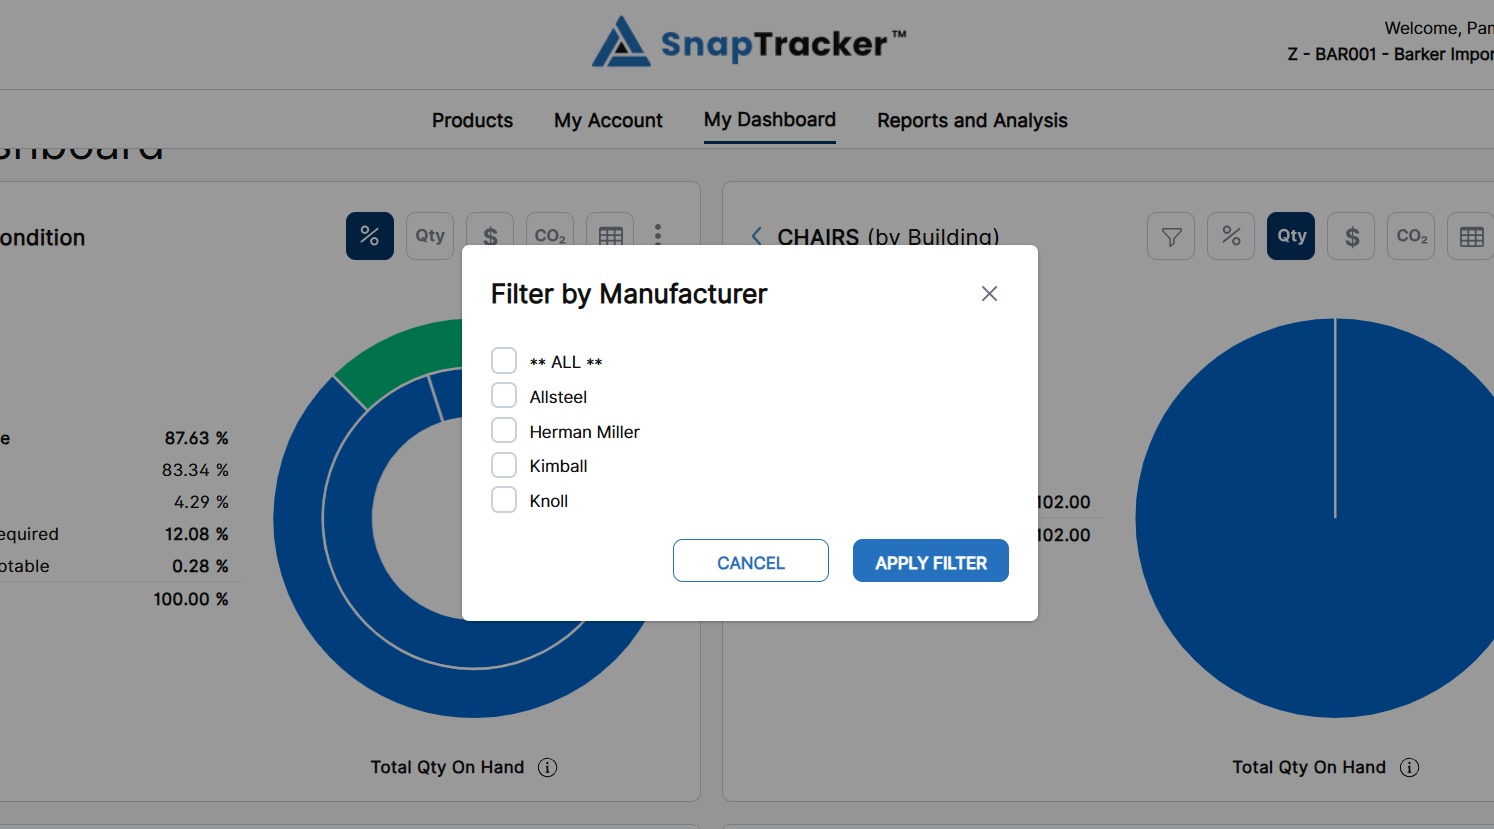
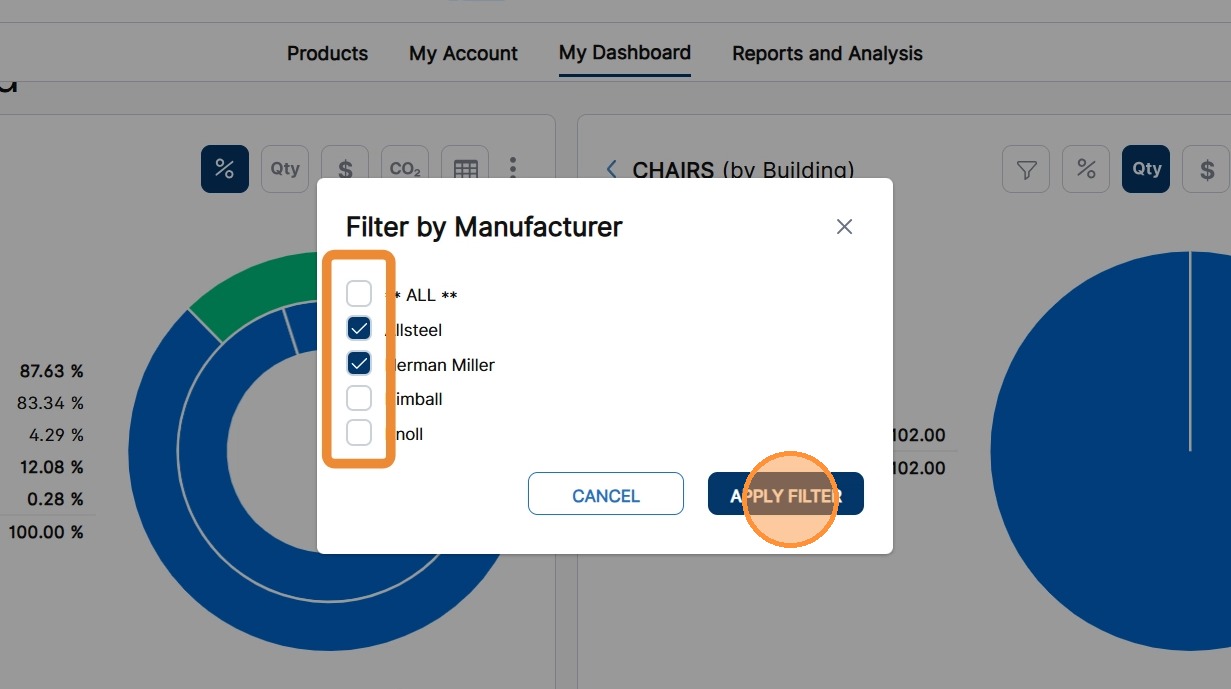
9. Select the checkbox beside options to filter, then click Apply Filter.
The report updates, with data displaying based on the selected filter.
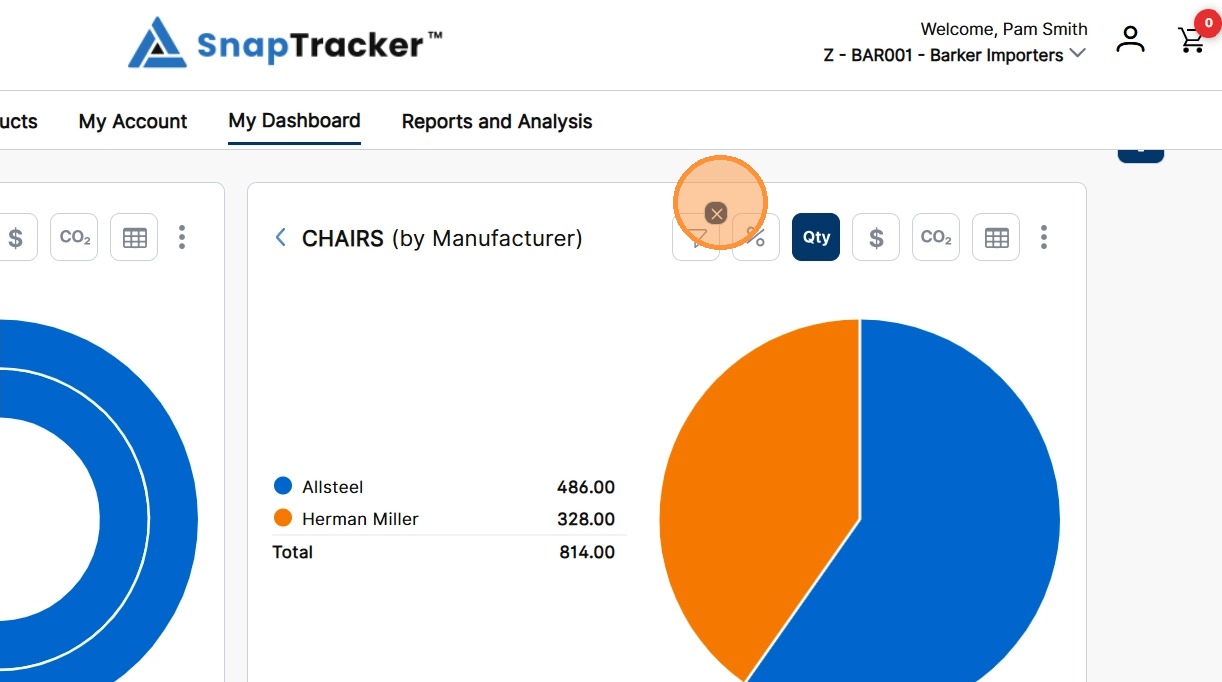
10. To drill back up a level, click the arrow icon.
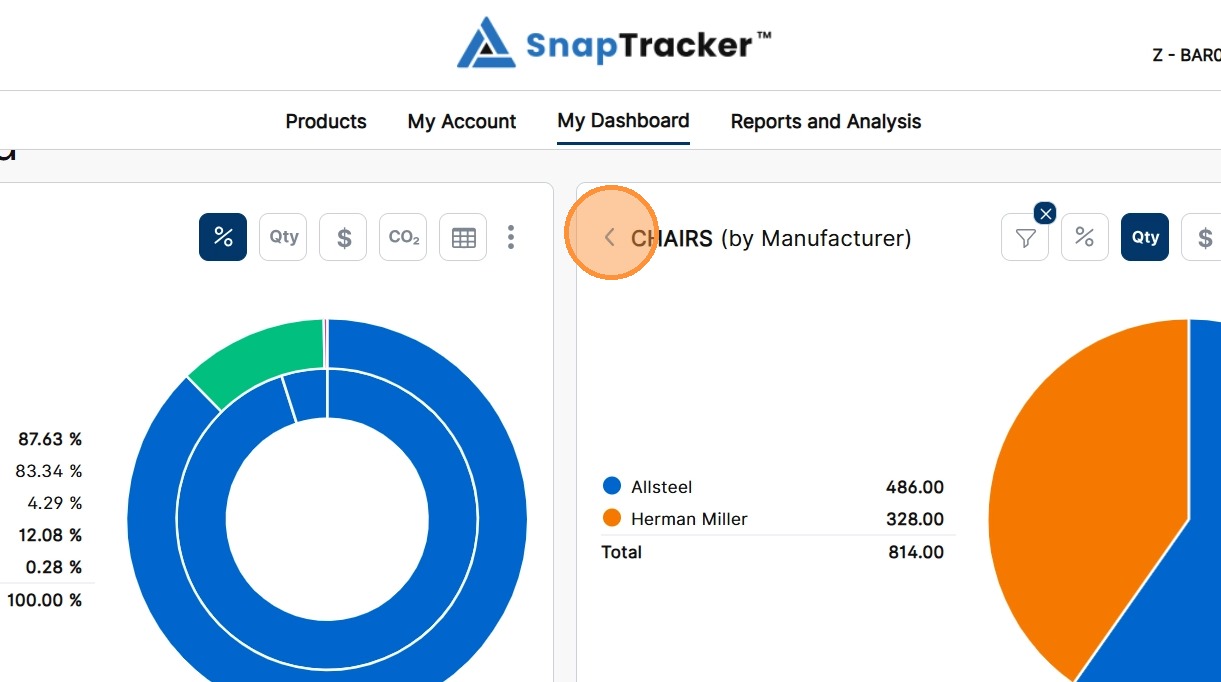
11. To clear the selected filter, at the top right of the filter icon, click X.