
How to Use the Building Usage by Location Report
The Building Usage by Location Report is an inventory report that provides a detailed analysis of the usage of a Building by Locations. The report generates space utilization based on the size and percentage full of a Location, in square feet or cubic feet. Various key building usage metrics are also available per Location, such as the total quantity of product, storage costs, and estimated footage. The report includes a final level of details regarding total quantity per Standard Class within a Location.
Note: The estimated square footage displayed in the report is based on the assumption that each Location has a percentage full added to calculate used footage.
The initial view is graphical. You can also view information in a table format and export the data to a CSV file.
Before starting, make sure:
- You are logged into SnapTracker.
- You have access to My Dashboard.
- You have access to the Building Usage by Location Report.
- You have access to at minimum one Building with inventory.
- At minimum there is one Standard created for the selected Customer.
- The correct Customer is selected from the Customer selection list.
This post outlines how to navigate and use the Building Usage by Location Report.
1. To access the Building Usage by Location Report, from the header, click My Dashboard.
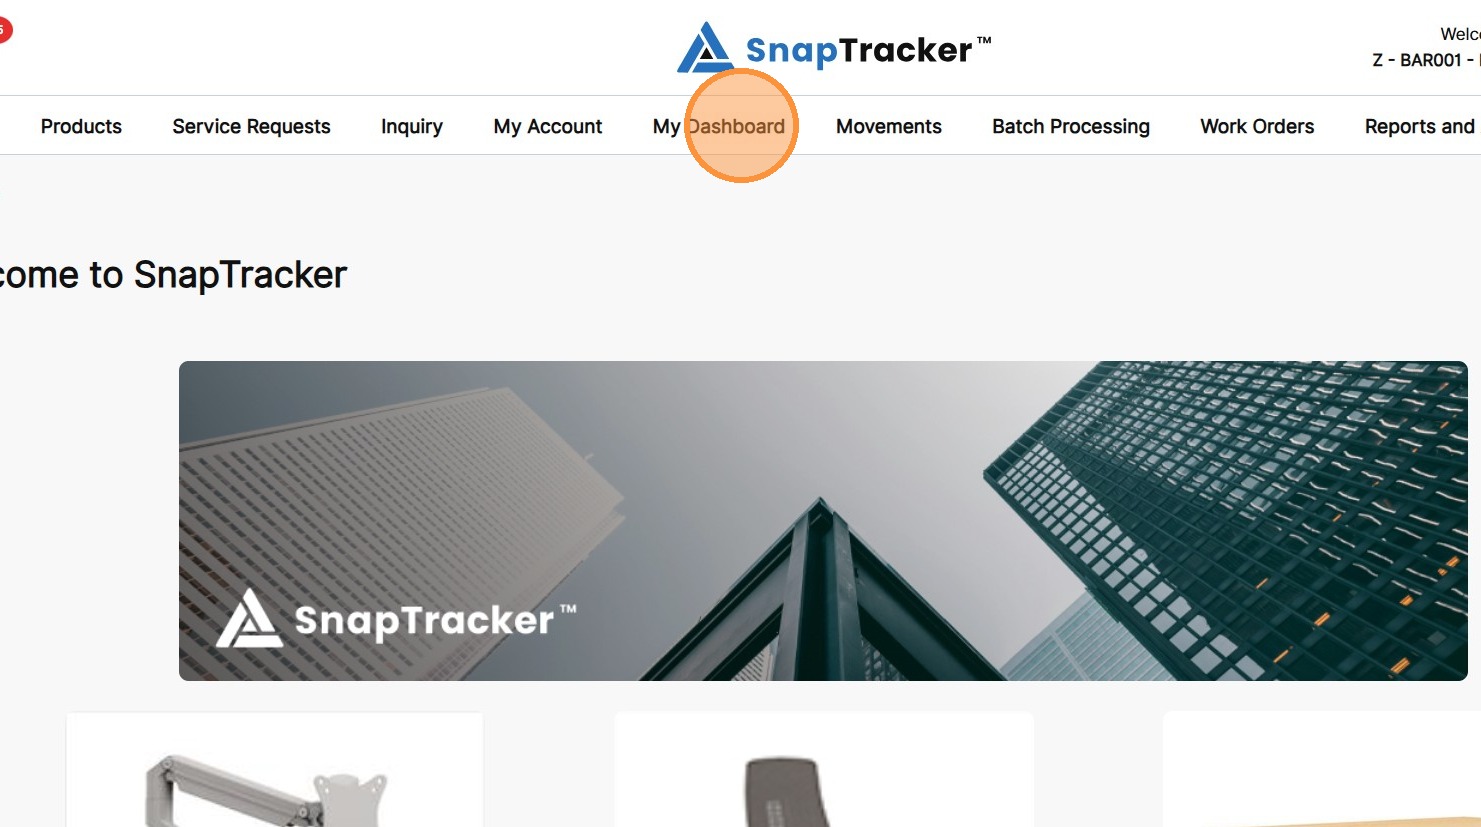
The My Dashboard screen displays with all dashboards you have access to.
2. Locate the Building Usage by Location Report.
Note: The top level of this report displays information by Building.
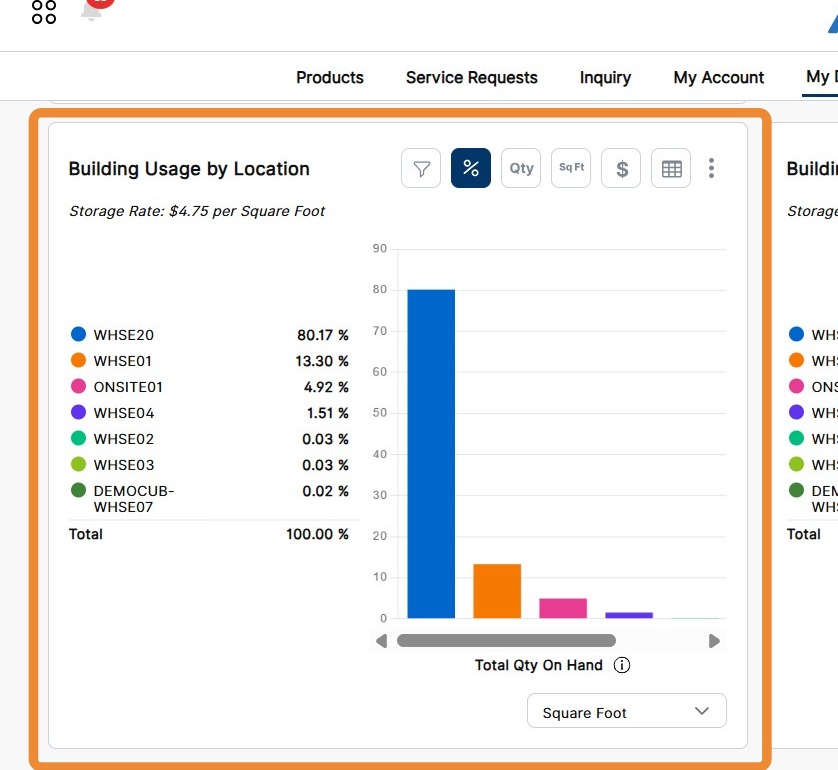
Key information in this report is generated using information entered in the Customer screen.
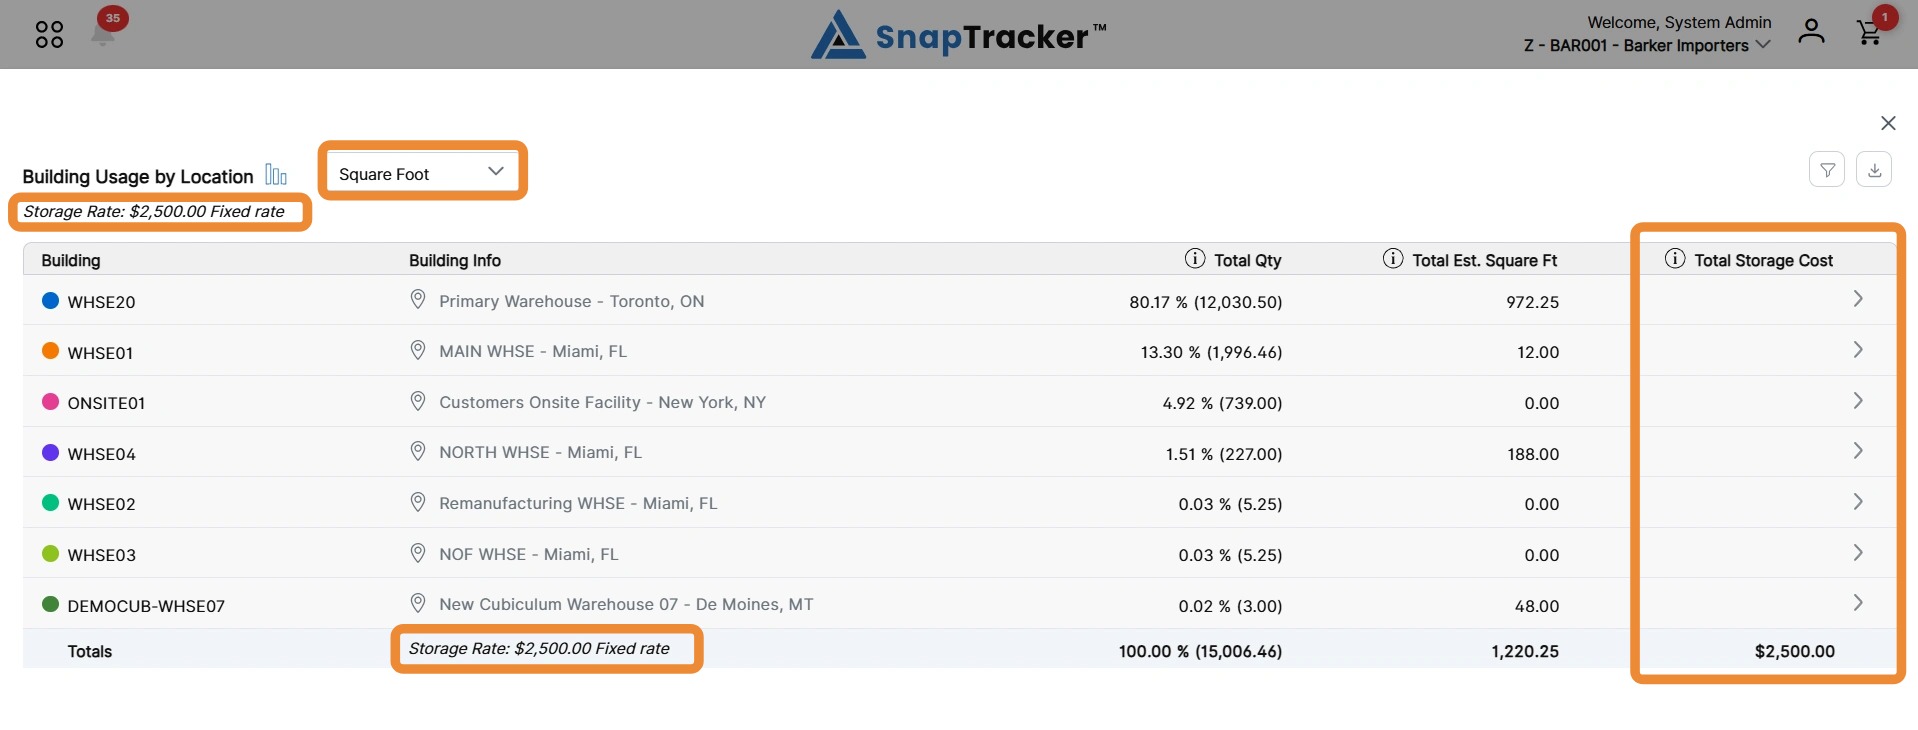
- Storage Rate – The Storage Rate is based on the Customer Storage Charge Indicator (Fixed, Sq. Ft., or Cb. Ft.) and Storage Rate in the Customer screen. This rate is used to calculate the Total Storage Cost field in the report. Note: If the Storage Charge Indicator is set to Fixed, the Storage Rate/Cost is a fixed value at the Customer level. The Building level Storage Cost is blank and only shows a value in the Total section.
- Footage – The Footage selection is populated based on the Storage Charge Indicator (Fixed, Sq. Ft., or Cb. Ft.) in the Customer screen. If the Storage Charge Indicator is set to Fixed, the report defaults to Square Foot. You may change the selection within the report. This selection is used to generate the Footage field (multiplied by the Location Percentage Full field) in the Chart and Table view.
Note: To change the defaults used to generate the Report, the respective fields in the Customer screen must be updated.
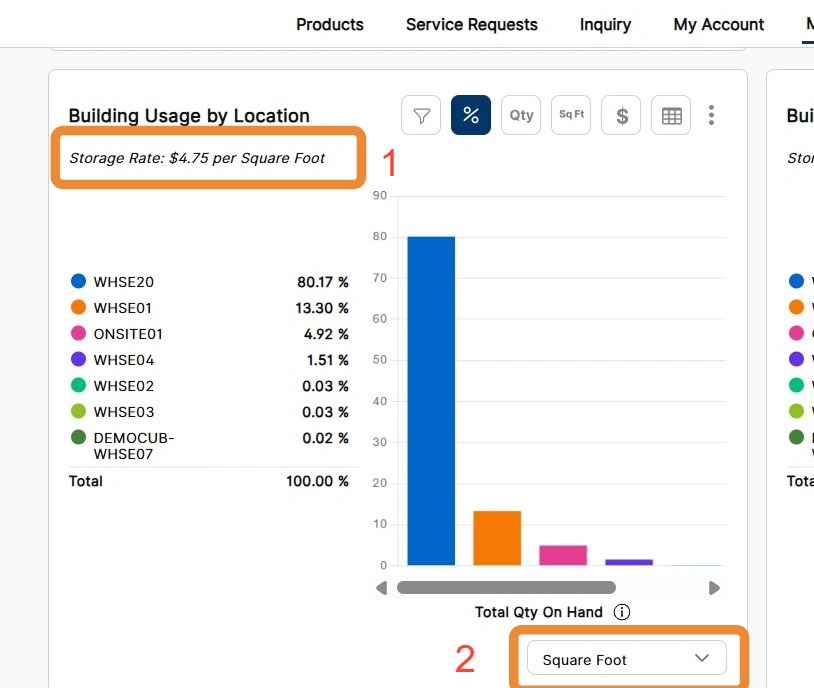
3. To see the tooltip metrics for the different Buildings in the report, hover over the section in the Chart.
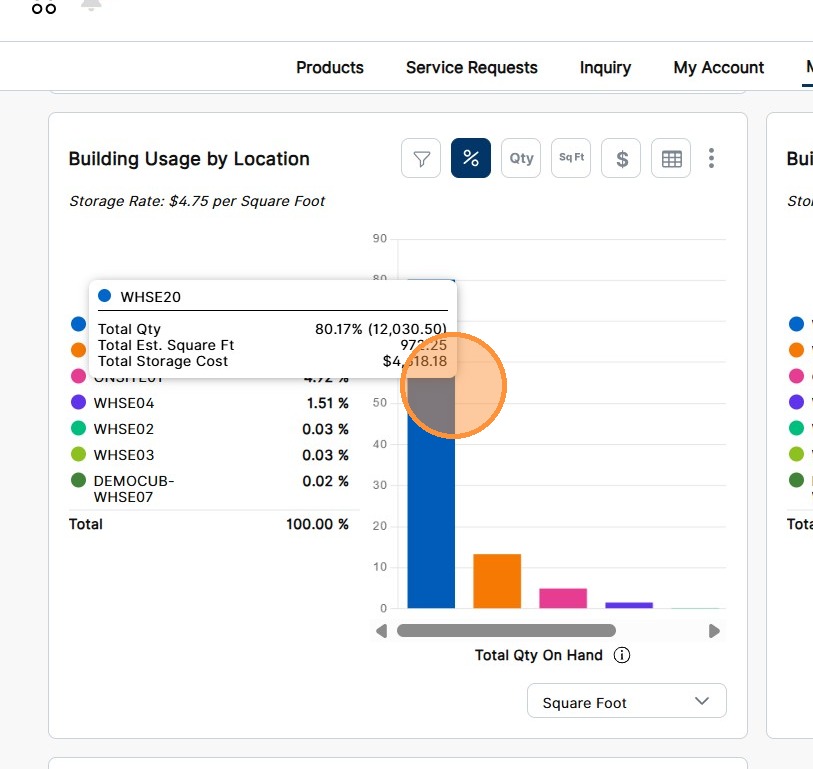
There are different views available on the graph.
Observe the toggle views:
- % – Percentage distribution, based on Quantity. Identifies the percentage of the quantity per Building against all products on hand.
- Qty – Units of product. Identifies the quantity of products per Building.
- Sq Ft/Cb Ft – Footage. Identifies the total footage of all Locations per Building, in Square Foot or Cubic Foot based on the Footage selection multiplied by the Location Percentage Full field.
- $ – Storage Cost. Identifies the total Storage Cost of all Locations per Building, based on the Storage Rate multiplied by the Footage and Location Percentage Full.
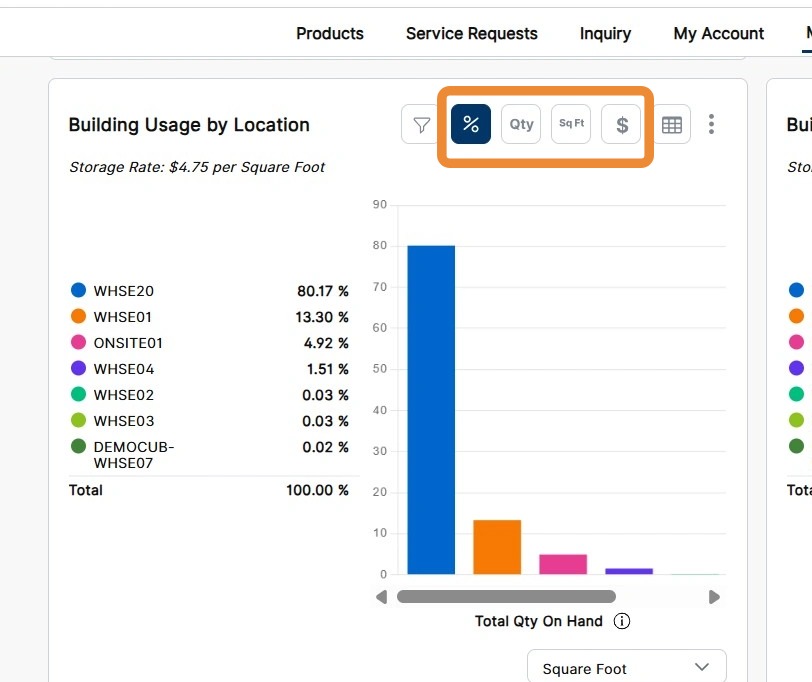
4. To view details on more Buildings, click and drag the horizontal scroll bar.
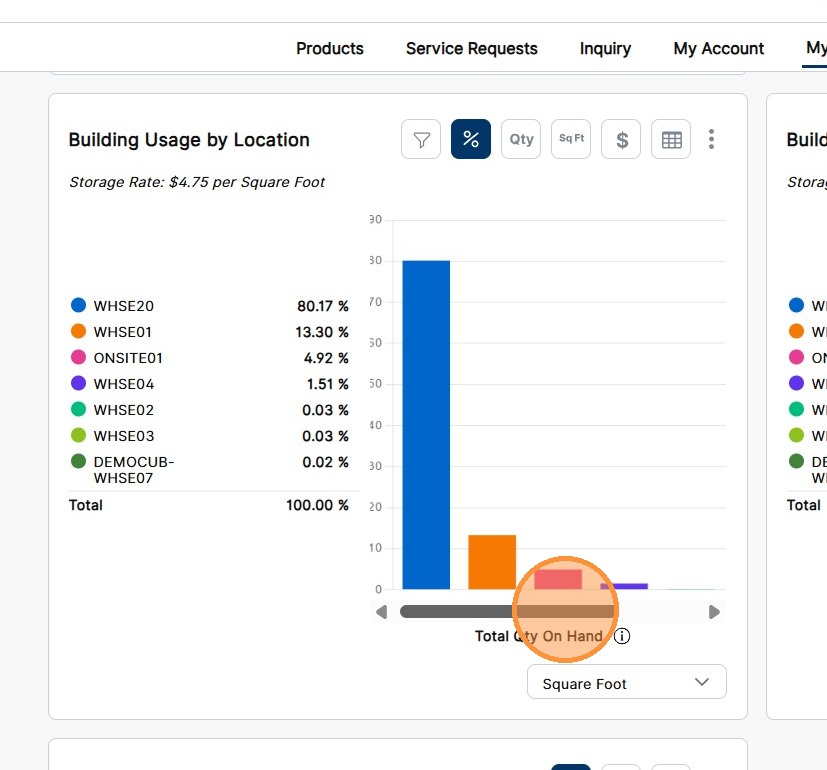
5. To change the Footage displayed in the report, select the Footage selection dropdown and choose the desired measurement.
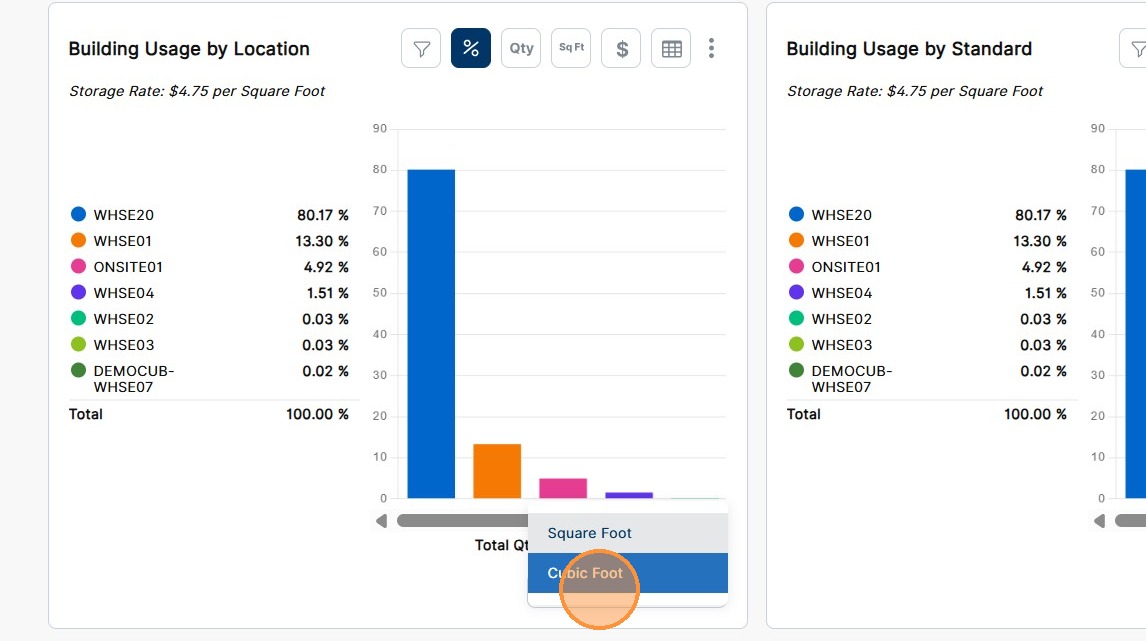
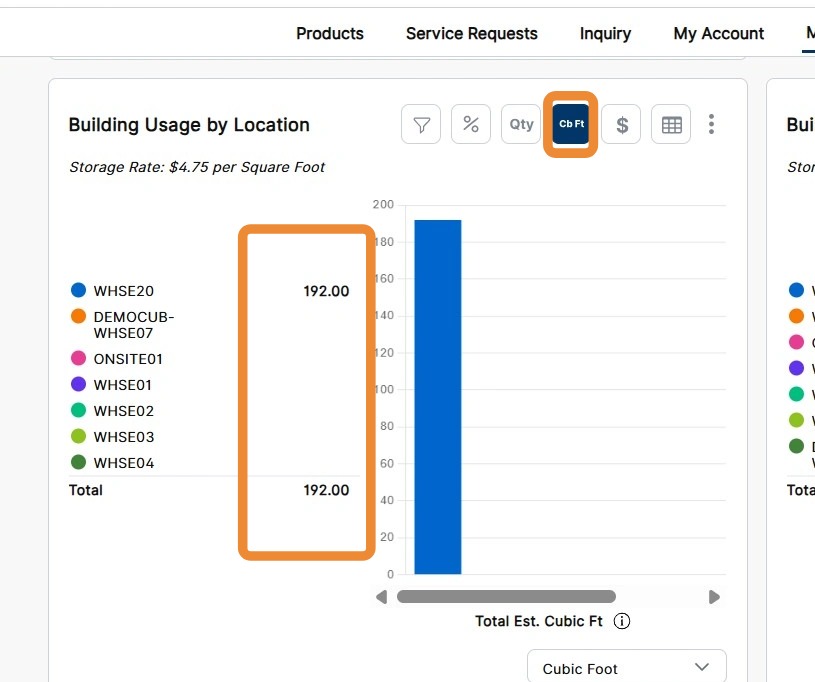
The report updates with the Cb Ft toggle view button highlighted. The results display Cubic Footage information, if available.
Note: If Square Footage or Cubic Footage information at the Location level is not entered (or it is 0) for any Locations at all in a Building, the summarized totals at the Building level do not display (or appear blank).
6. To filter the top level results, click the Filter icon and select the filter category as desired.
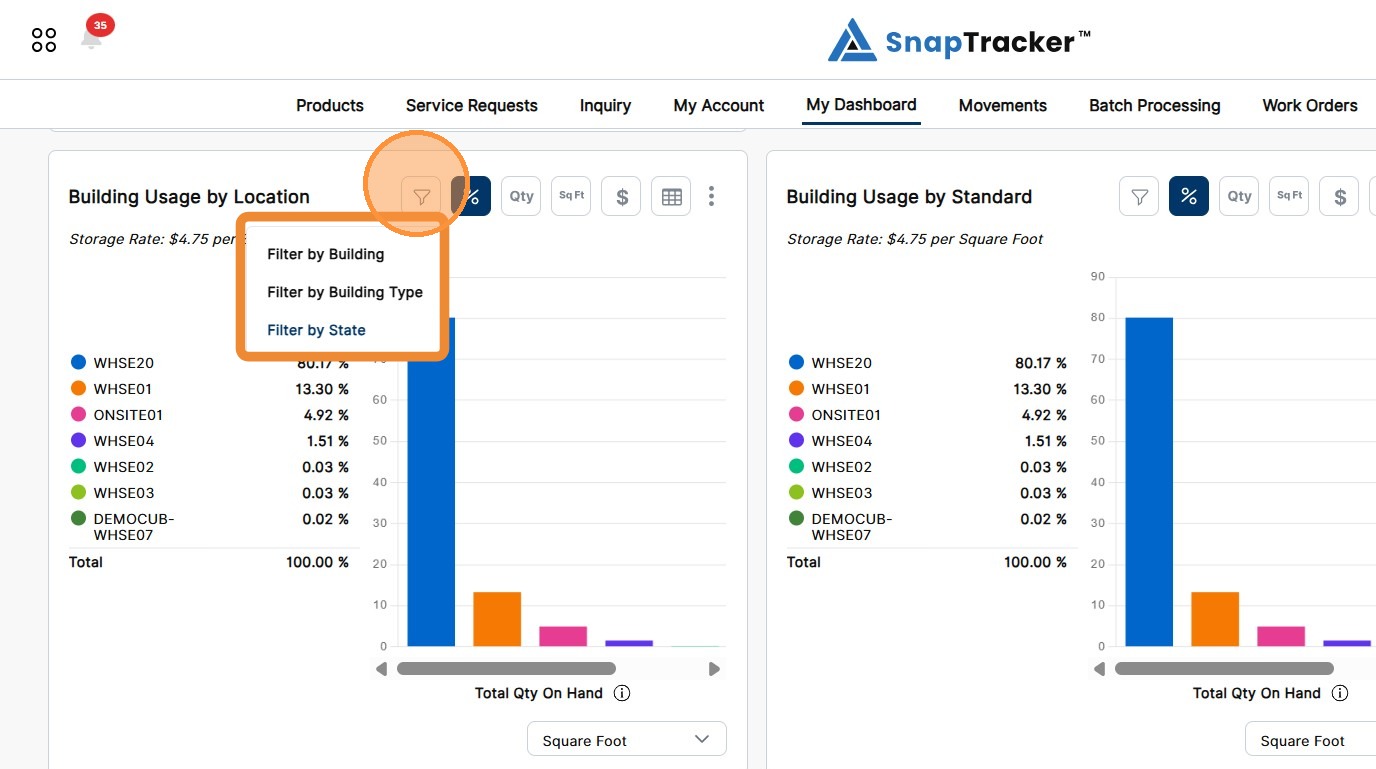
Top level Filter Categories include:
- Filter By Building – Select the specific Building(s) you would like to see the building usage for.
- Filter By Building Type – Select the type of Building you would like to see building usage for. Building Type organizes Buildings with similar functions. For example, warehouses may be grouped under one Building Type, onsite buildings as a second Building Type and client-owned warehouses as a third Building Type.
- Filter By State – Select the States you would like to see the building usage for. State is a field that can be entered for each Building in SnapTracker.
7. Select the checkbox(es) for the desired filter options and click Apply Filter.
To close the pop-up, click Cancel or X.
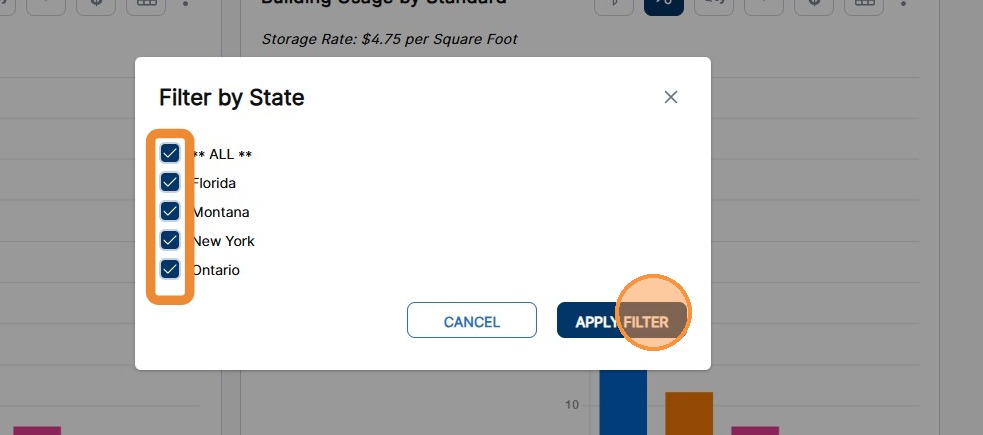
The graph updates to show the results based on the selected filter.
To clear filters, click X on top of the filter icon.
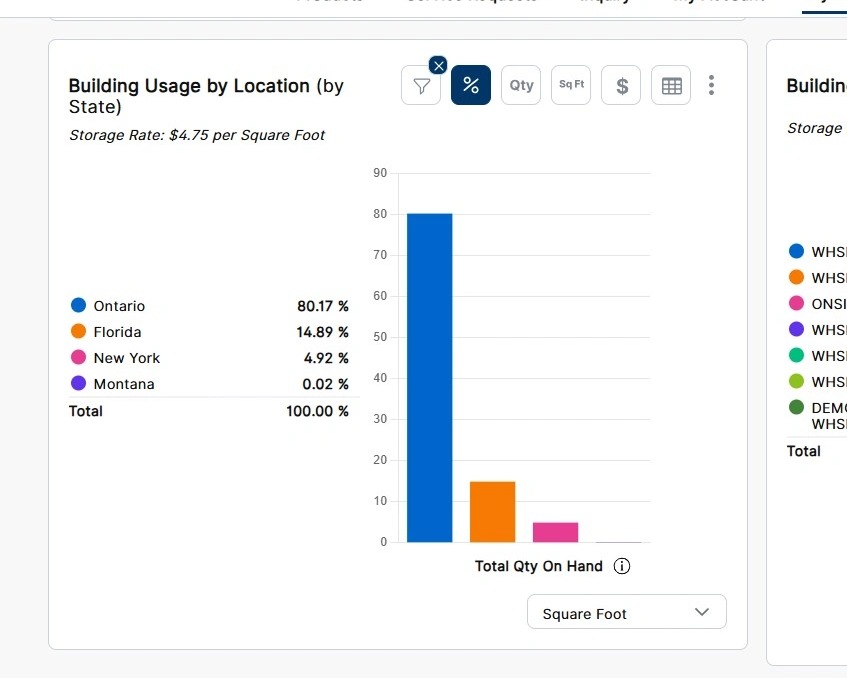
8. To see the Buildings within a filter category, click the circle icon of the desired option.
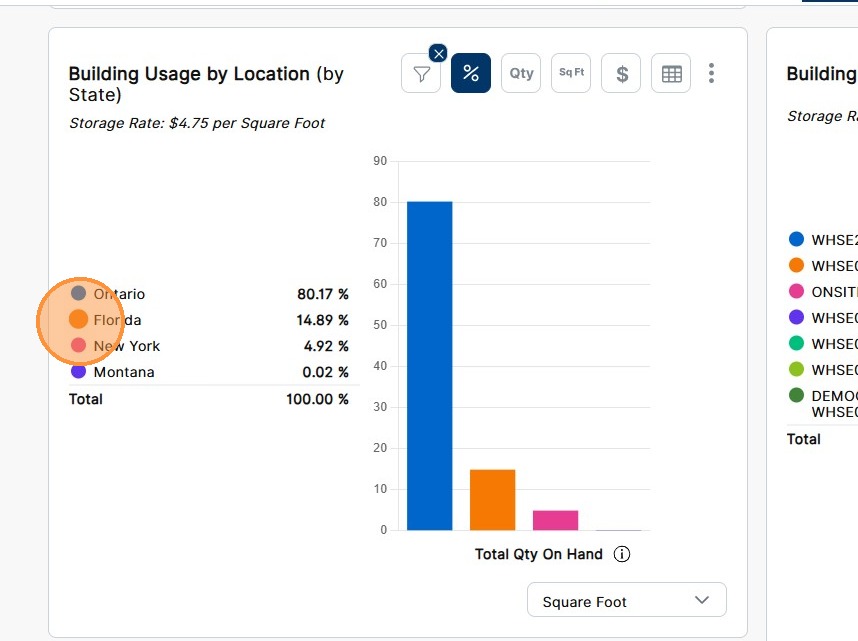
9. The filtered Building(s) display.
To navigate back to the previous report level (if available), click the arrow icon beside the title.
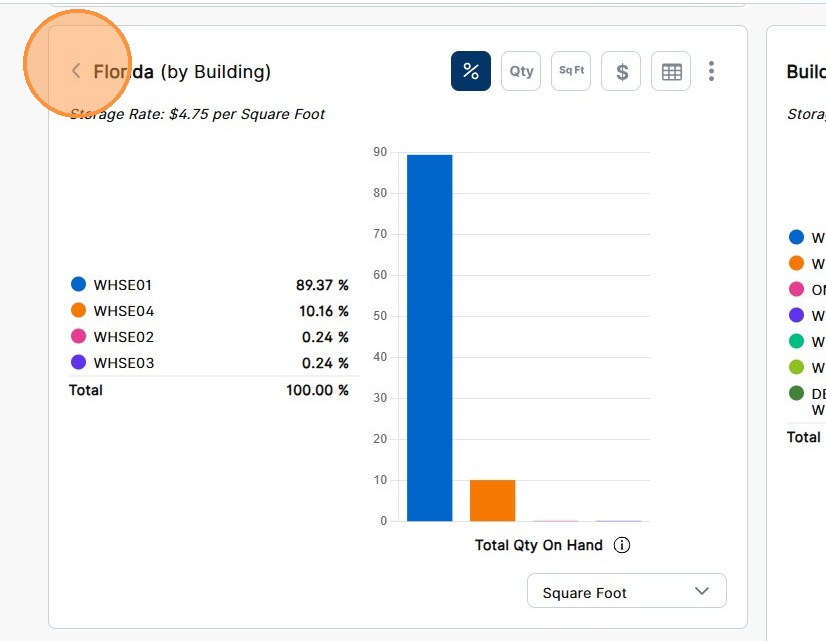
10. To view more information for a given Building, from the top level of the report, click the circle icon of the desired Building.
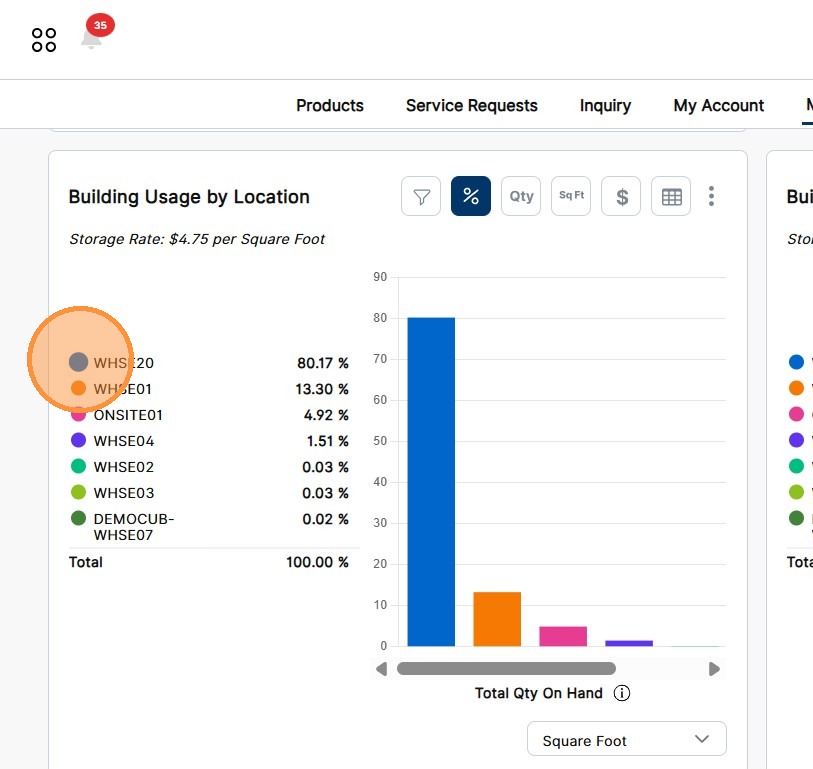
The graph updates with the secondary level of the report, showing a breakdown by the Location Types within a Building.
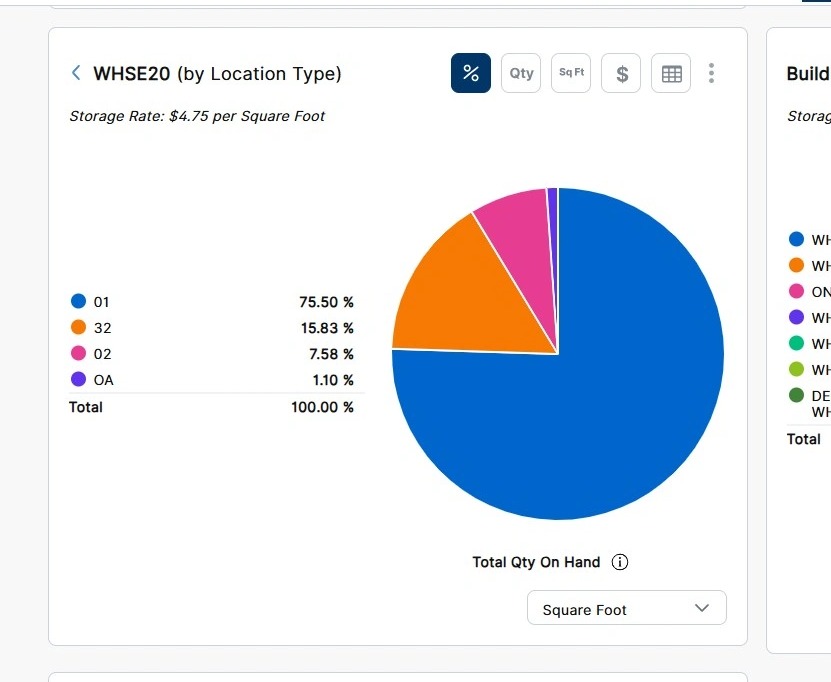
11. To export the report data as a CSV file, go to the desired report level in Chart view and click the ellipses icon.
Click Export as CSV.
Note: To export the report in the Table view, click the download icon.
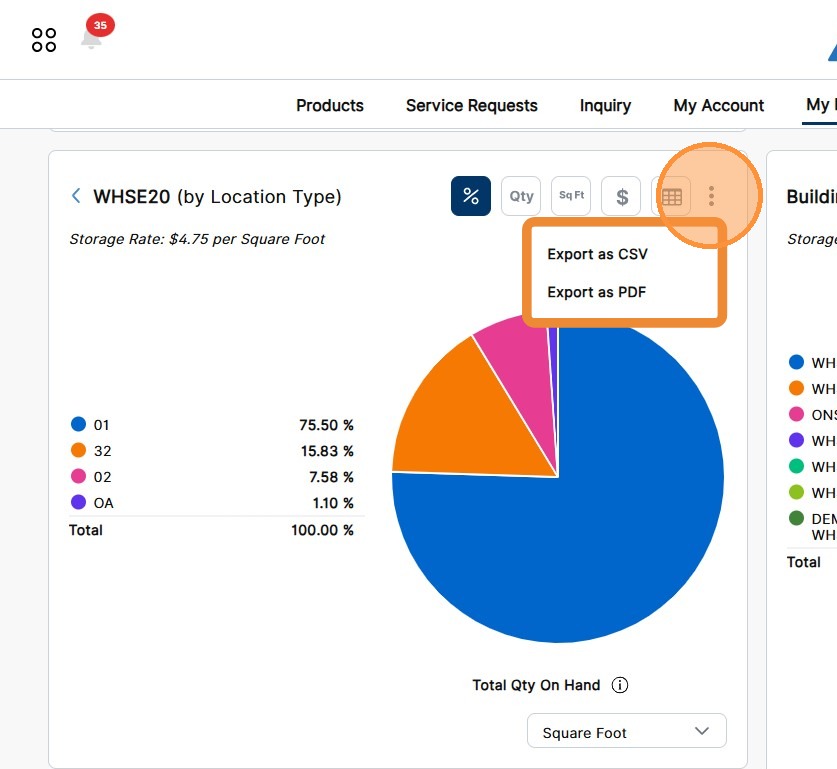
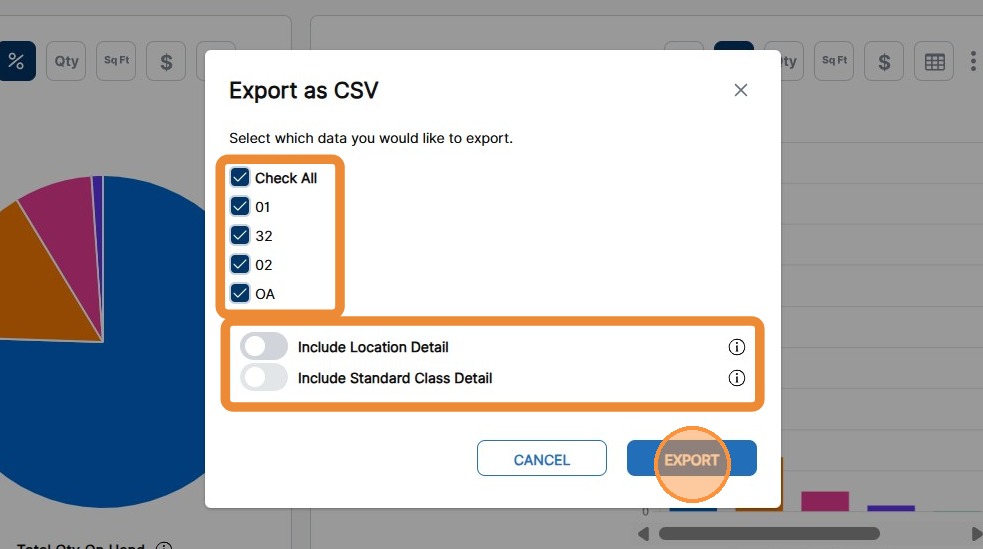
12. In the Export as CSV pop-up, select the checkbox(es) for categories to export and click Export.
Note: If you are on the secondary level of the report, you can decide to export the Standard Details by clicking the Include Standard Detail toggle to ON.
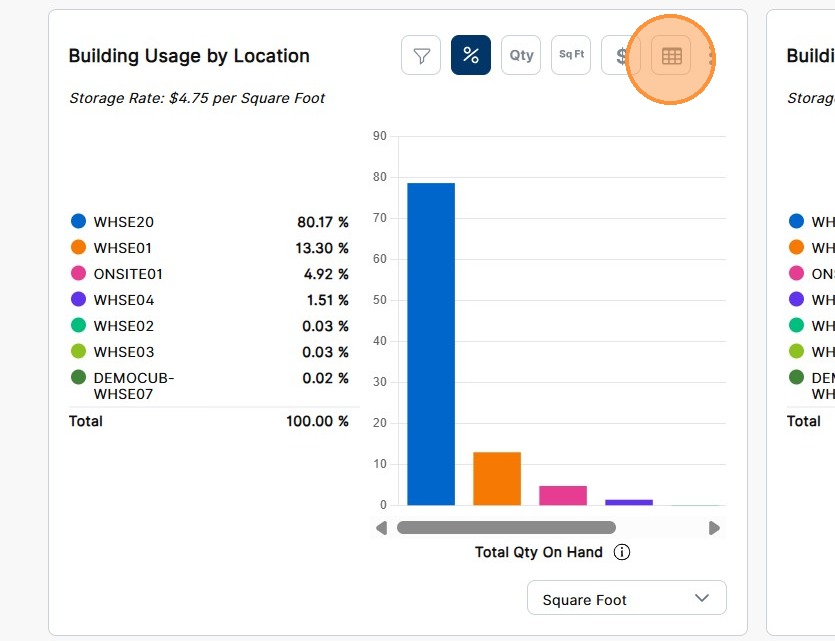
13. To view the Table View of the report from the Chart, click the Table icon.
Note: The Table icon is available at all levels of the report. The results displayed vary based on the level you are at when you click the icon.
The top level of the Building Usage by Standard Report displays.
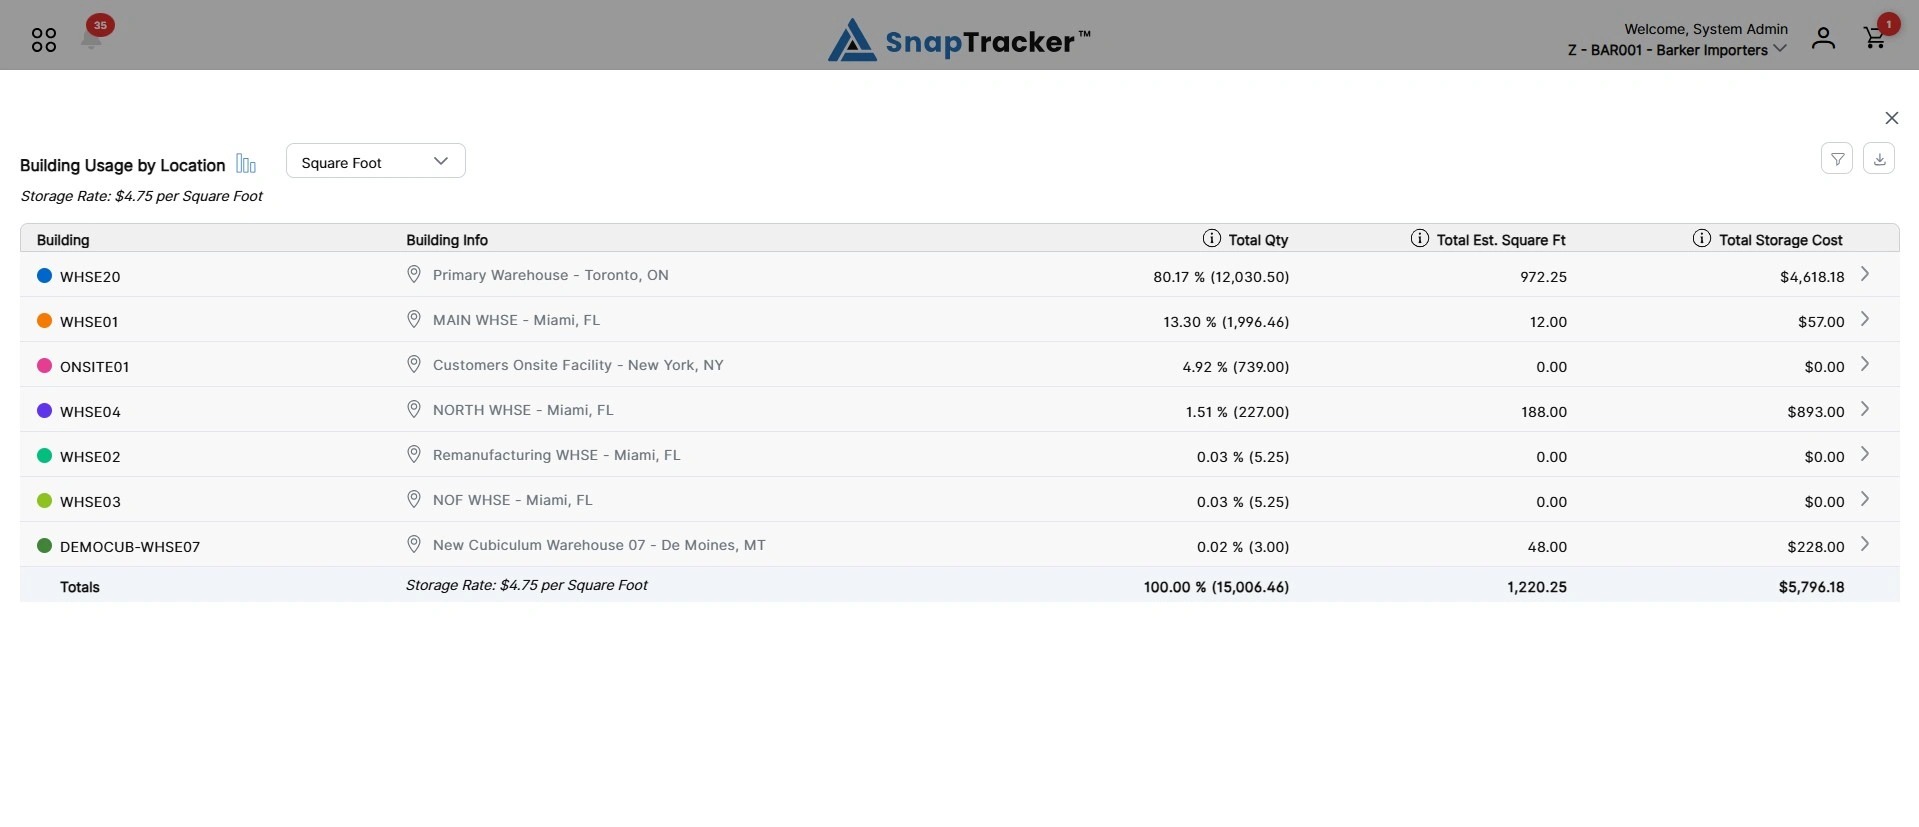
Observe the top level in the Table View:
- Building – The Building.
- Building Info – The Building information, using the following structure “Building Description – City, State”.
- Total Qty – The Quantity of all items within a Building.
- Total Est. Square/Cubic Foot – The total Footage of Locations within a Building based on the Footage selection multiplied by the Location Percentage Full field. Note: If you do not have Square Footage or Cubic Footage and Percentage Full entered at the Location level, those fields do not display a value. The summarized totals at the Building level may be blank if no information is available.
- Total Storage Cost – The Total Storage Cost of all Locations within a Building, based on the Storage Rate multiplied by the total Footage. Note: If the Storage Charge Indicator is Fixed, the value is blank in the column and only shows a value in the Totals section.
Key information in this report also displays in the Table View.
- Storage Rate – The Storage Rate is calculated based on your Storage Charge Indicator (Fixed, Sq. Ft., or Cb. Ft.) and Storage Rate in the Customer screen.
- Footage Selection – The Footage selection is populated based on the Storage Charge Indicator (Fixed, Sq. Ft., or Cb. Ft.) in the Customer screen.
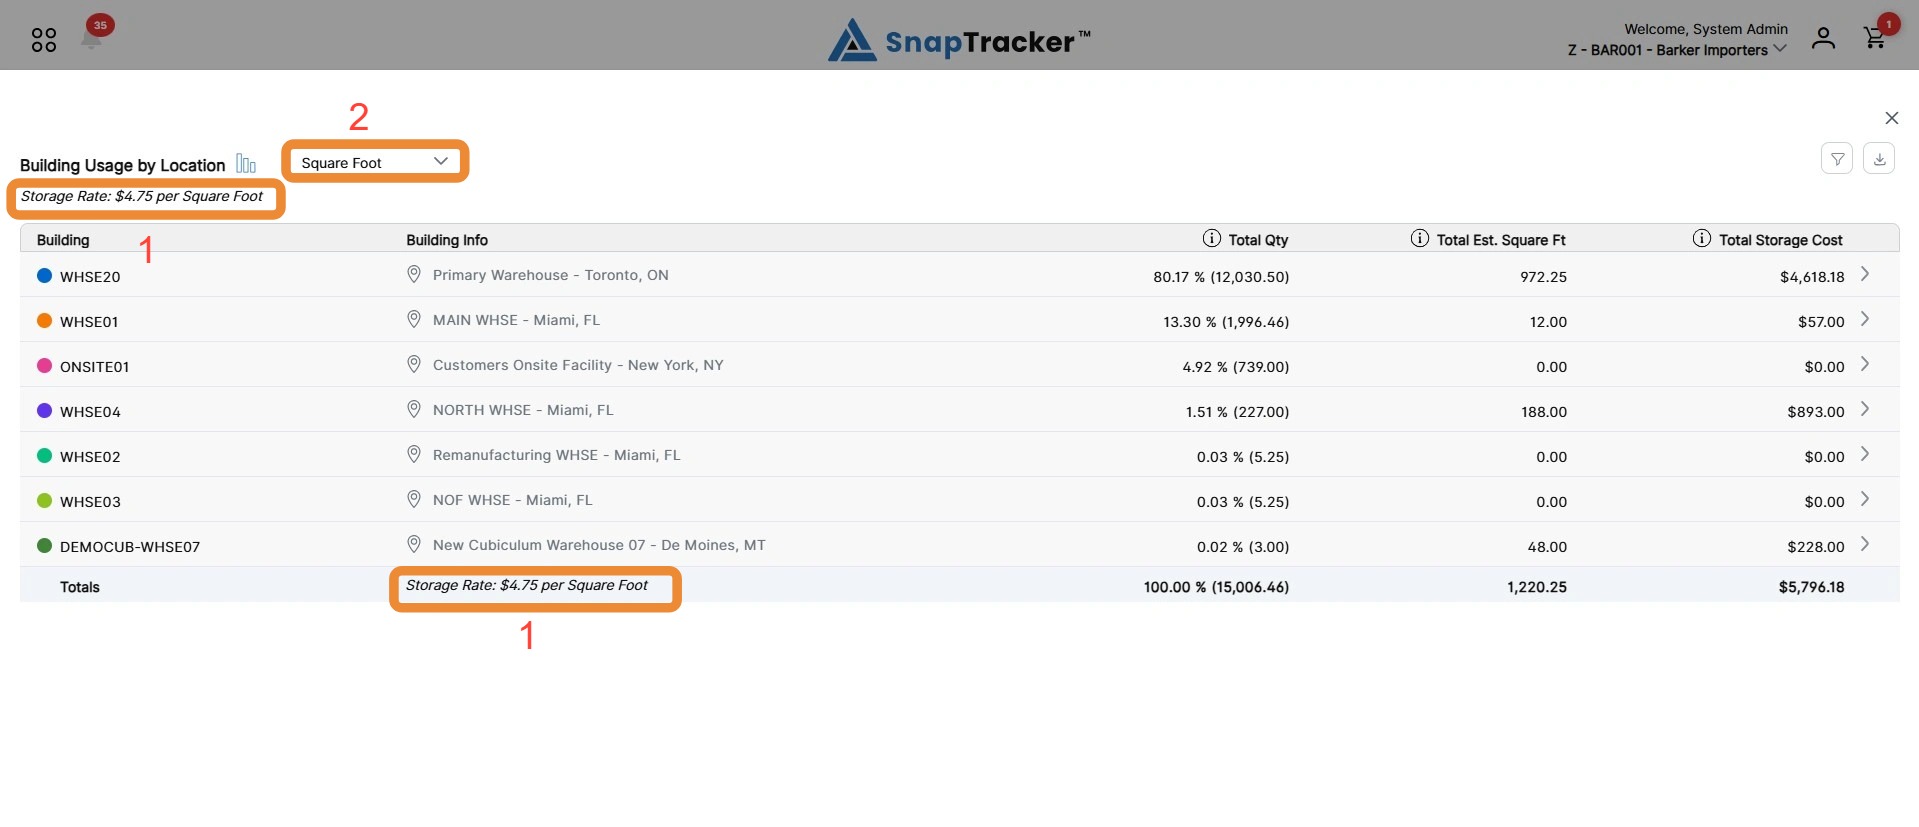
Note: If the Storage Charge Indicator is Fixed, the Footage Selection field defaults to Square Foot.
When the Storage Charge Indicator is set to Fixed, the Storage Rate/Cost is a fixed value at the Customer level. The Building level Storage Cost is empty and only shows a value in the Totals section.
14. To view additional details for a Building in the Table View, click the row for the desired Building.
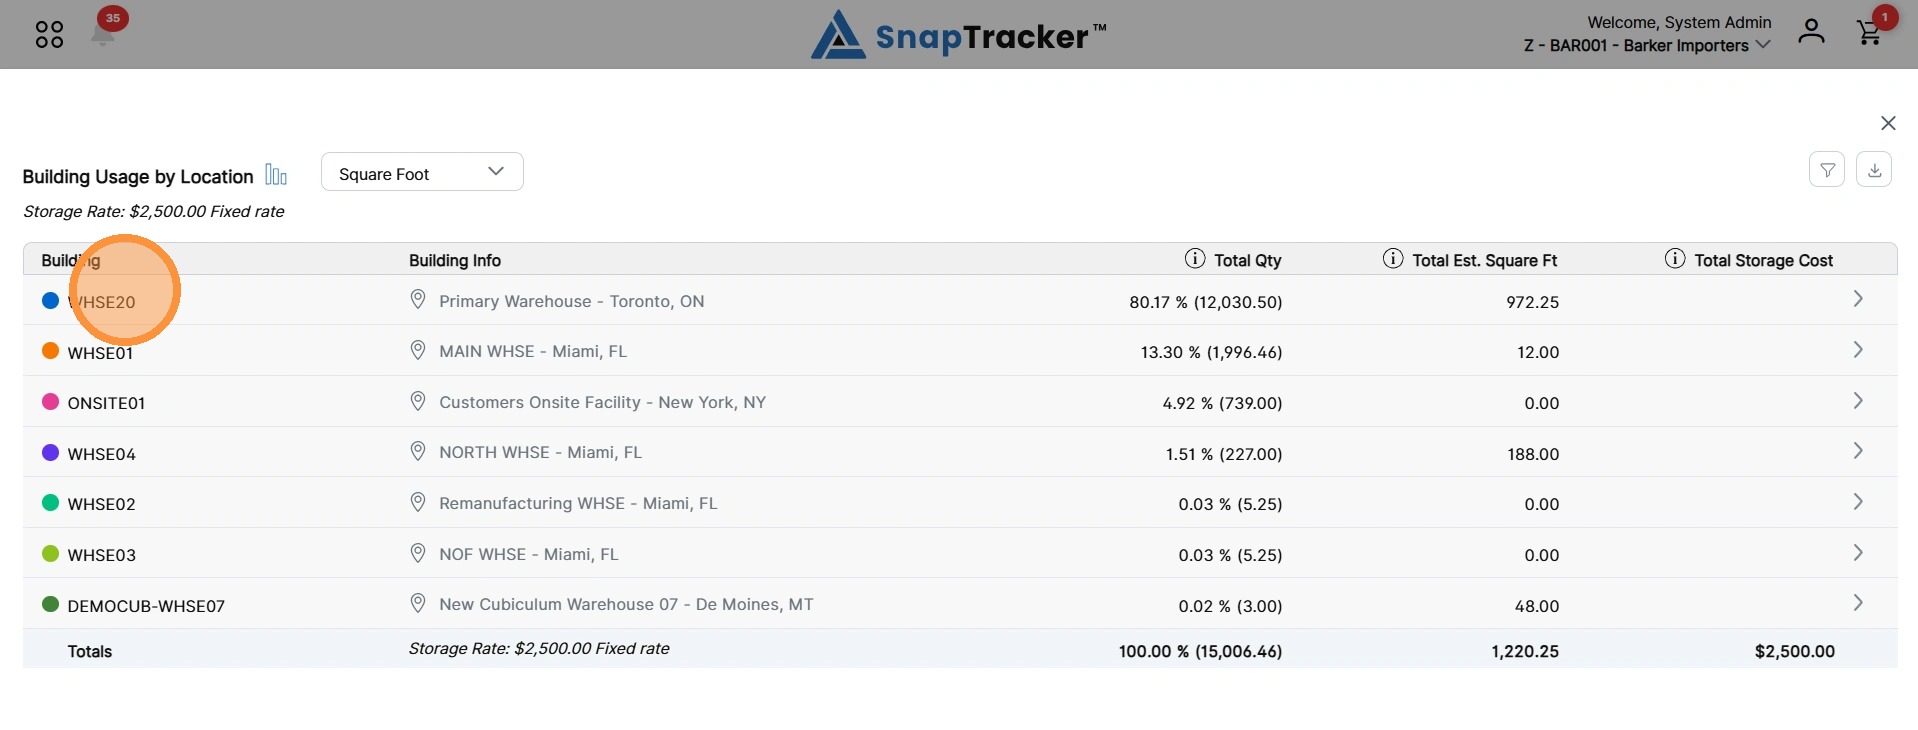
The secondary level of the report displays, showing a breakdown of all Location Types within the Building.
Note: The first Location Type expands by default when accessing this view.
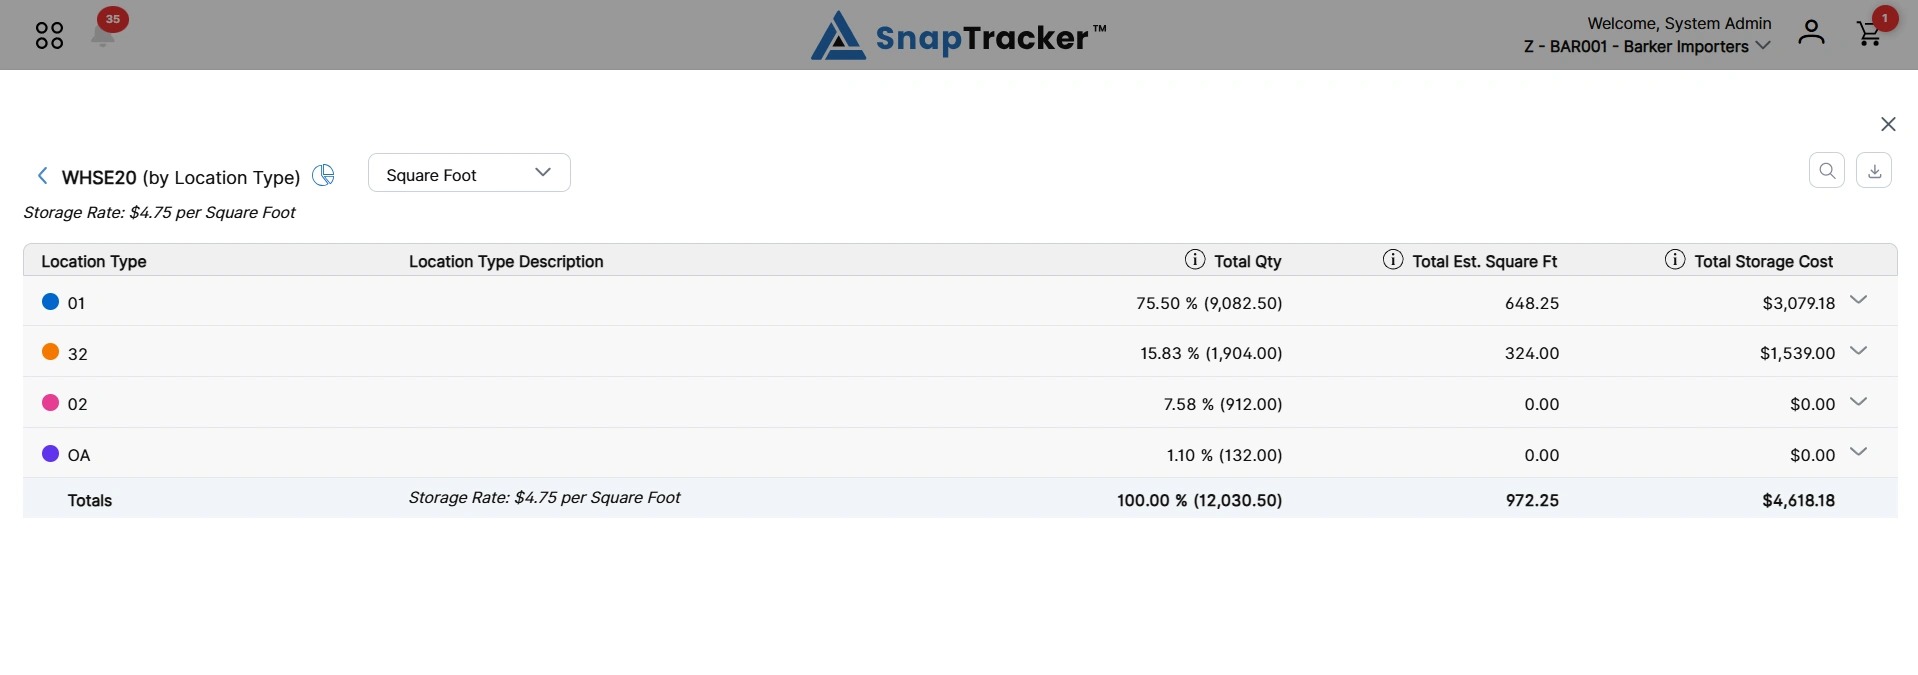
Observe the Location Type information:
- Location Type – The Location Type, used to divide the Locations in a warehouse into different sections. It is commonly used to identify different rows or aisles within the Building.
- Location Type Description – The Location Type Description (if available).
- Total Qty – The Quantity of all items within a Location Type.
- Total Est. Square/Cubic Ft – The total Footage of items in a Location Type. Note: If you do not have Square Footage or Cubic Footage entered at the Location level, the fields are blank. The summarized totals at the Location Type level may also appear blank.
- Total Storage Cost – The Total Storage Cost of all items in a Location Type, based on the Storage Rate multiplied by the total Footage. Note: If the Storage Charge Indicator is Fixed, the field is blank and only shows a value in the Totals section.
15. Alternatively, you can access the secondary level of the report from the Chart View by clicking the circle icon beside the desired Location Type.
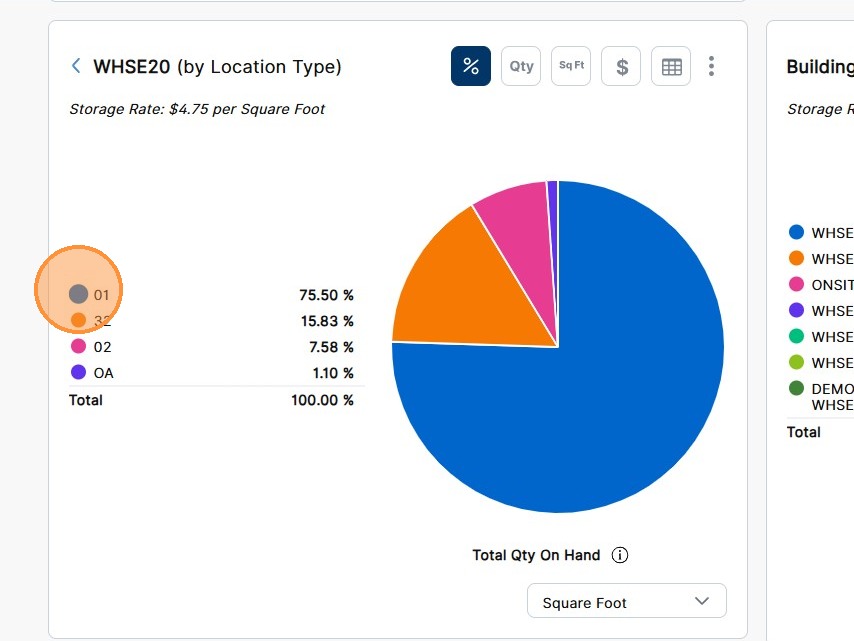
The secondary level of the report displays in Table View, with the selected Location Type expanded showing Location details.
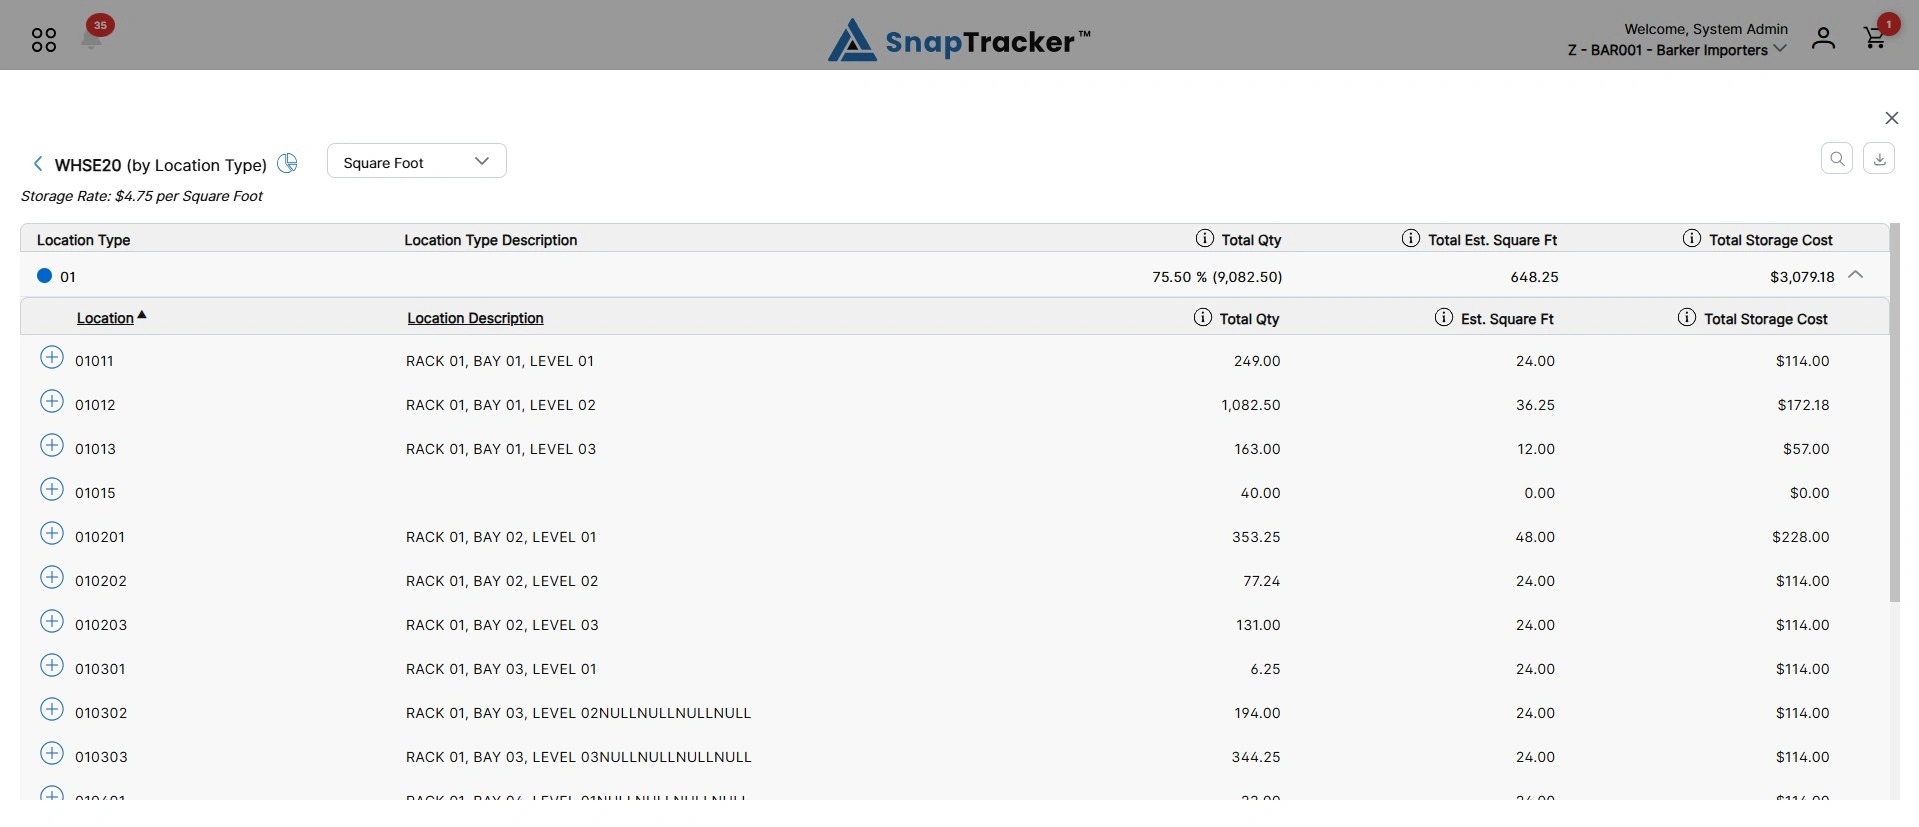
Observe the Location information:
- Location – The Location in the warehouse. This is the specific bay identifier the product currently resides in.
- Location Description – The Location Description (if available).
- Total Qty – The Quantity of all items within a Location.
- Total Est. Square/Cubic Ft – The total Footage of a Location multiplied by the Location Percentage Full. Note: If you do not have Square Footage or Cubic Footage and Percentage Full entered at the Location level, the fields are blank.
- Total Storage Cost – The Total Storage Cost of a Location, based on the Storage Rate multiplied by the Total Estimated Footage. Note: If the Storage Charge Indicator is Fixed, this is blank and only shows a value in the Totals section.
16. To view additional details of a Location, click the associated + icon.
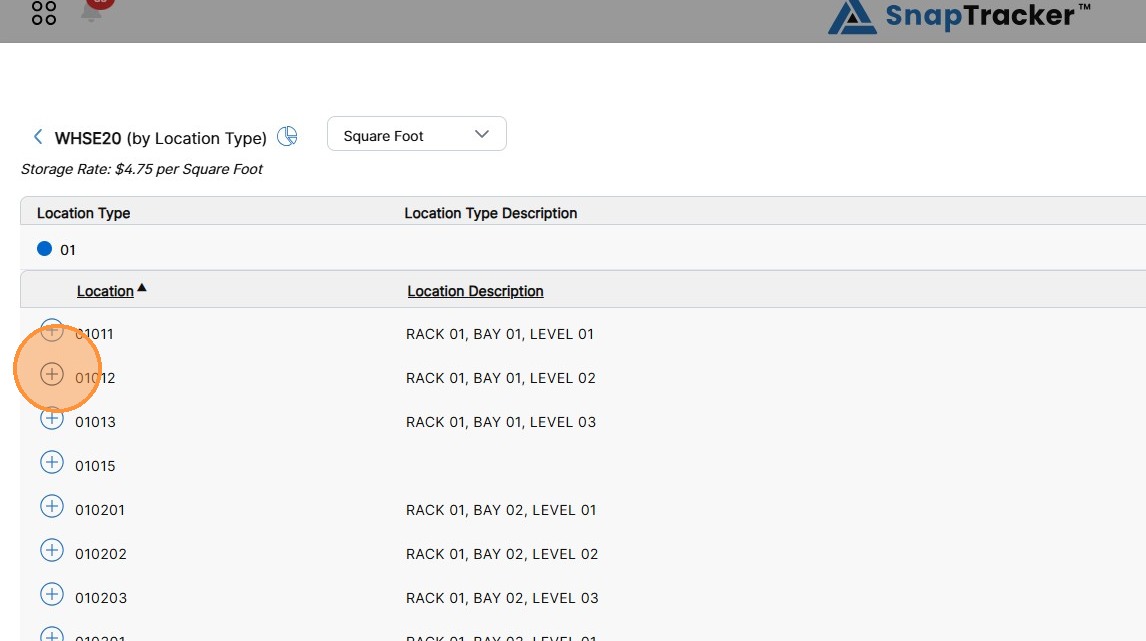
The detailed level information of a Location displays. Inventory information is summarized at the Standard Class level.
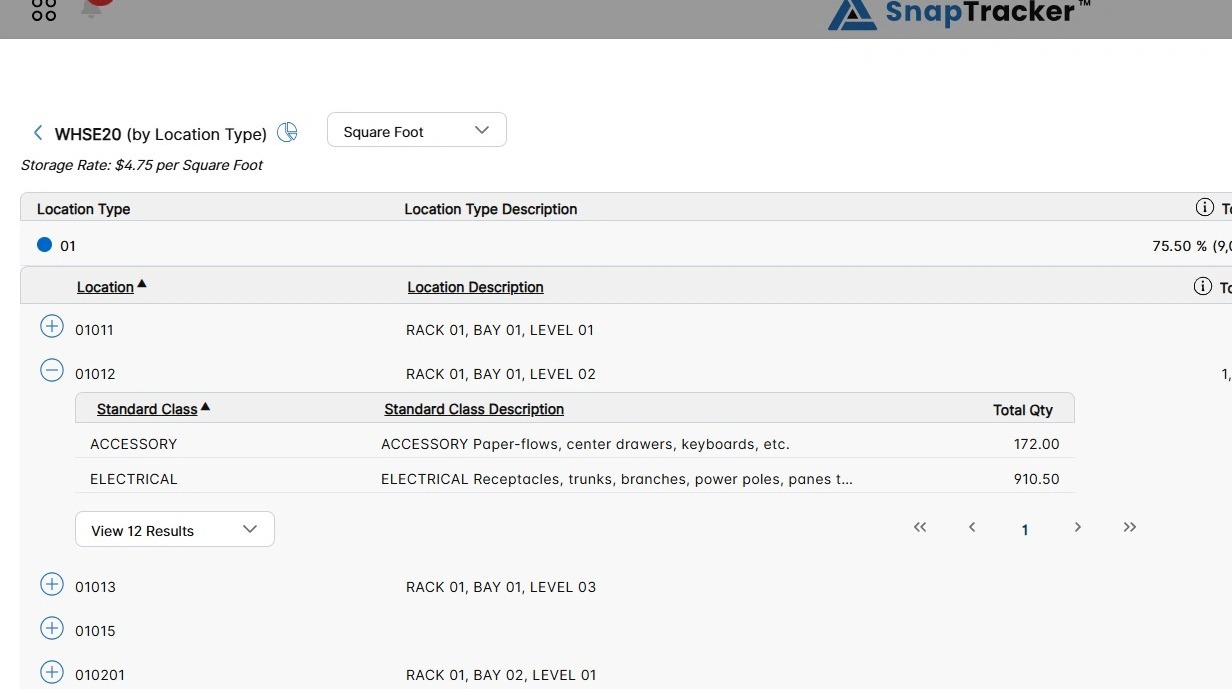
Observe the following Standard Class fields:
- Standard Class – The Standard Class.
- Standard Class Description – The Standard Class Description.
- Total Qty – The total quantity of items per Standard Class.
If square or cubic footage is entered at the Standard level, you can use the Building Usage by Standards Report to calculate information based on Standard information instead of Locations.
For more information on Building Usage by Standards, see “How to Use the Building Usage by Standard Report.”