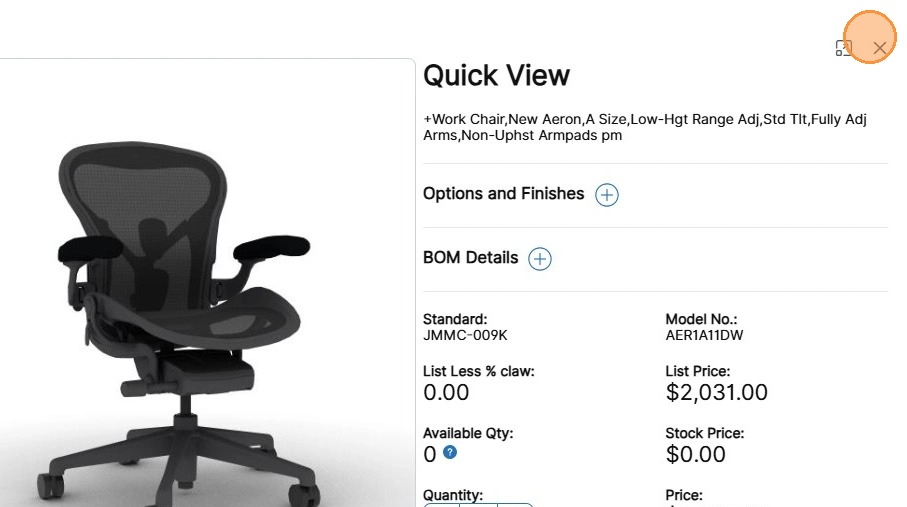
How to Use the Standards Creation Report
The Standards Creation Report provides an analysis of the Standards created for a selected Customer within a specified period. The report outlines the total volume of Standards created, summarized first by date range. Results can be filtered by Standard Class, or other desired filter categories. Various Standard details are included such as Standard descriptions, prices, date created, etc.
The initial view is graphical. You can also view information in a table format and export the data to a CSV file.
Before starting, make sure:
- You are logged into SnapTracker.
- You have access to My Dashboard screen.
- You have access to the Standards Creation Report.
- You have at minimum one Standard created.
- The correct Customer is selected from the Customer selection list.
This post outlines how to navigate and use the Standards Creation Report.
1. To access the Standards Creation, from the header, click My Dashboard.
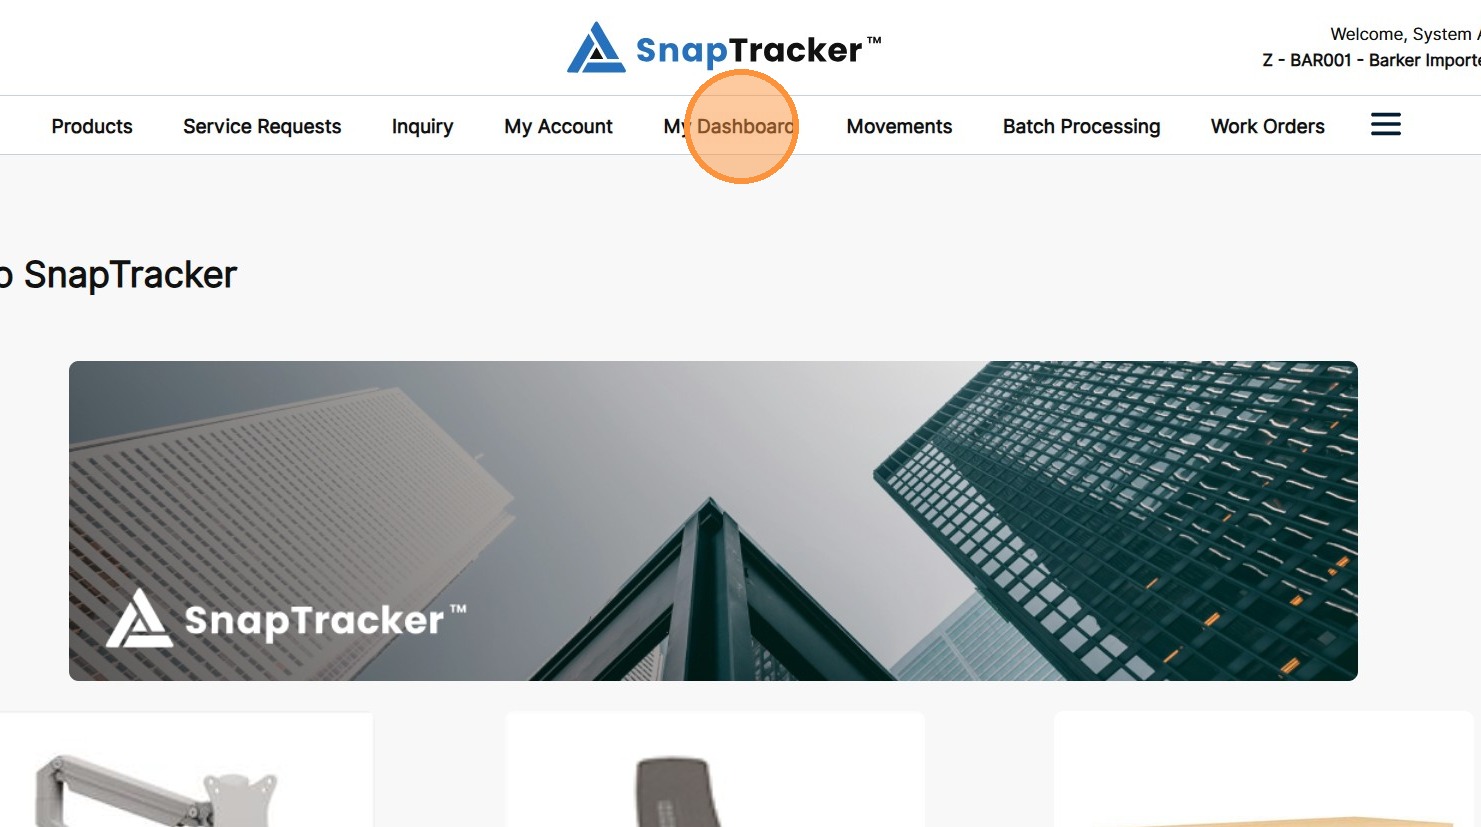
The My Dashboard screen displays with all dashboards you have access to.
2. Locate the Standards Creation Report.
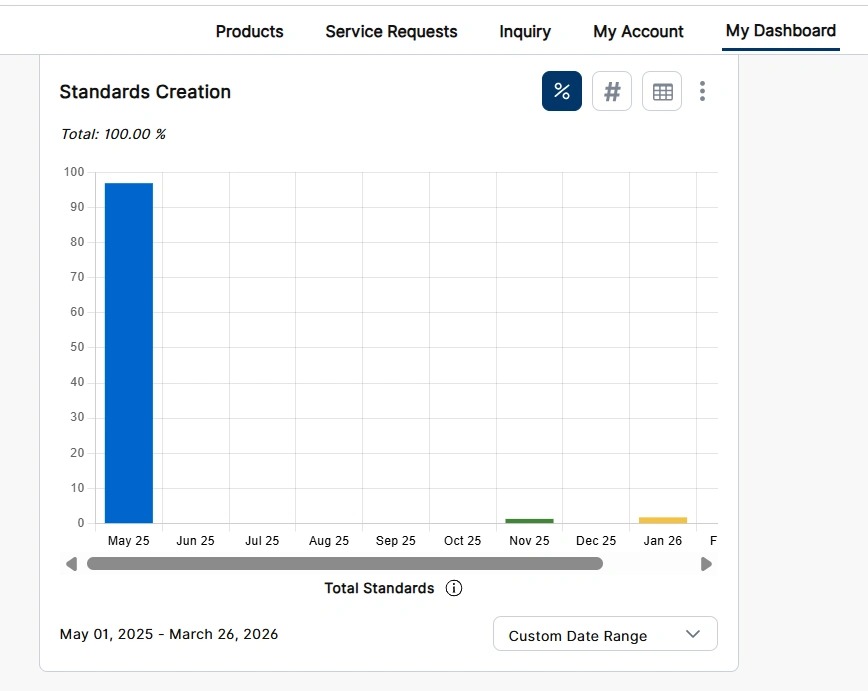
Note: The top level of this report displays Standards created by Month. By default it displays the current year to date.
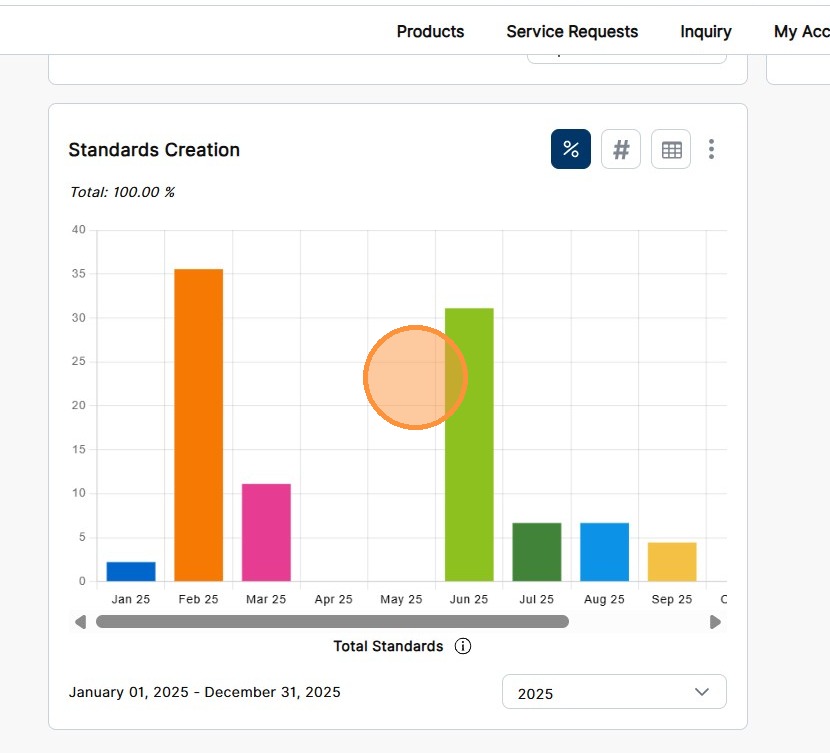
3. To see the tooltip metrics for the different Months in the report, hover over the month in the Chart.
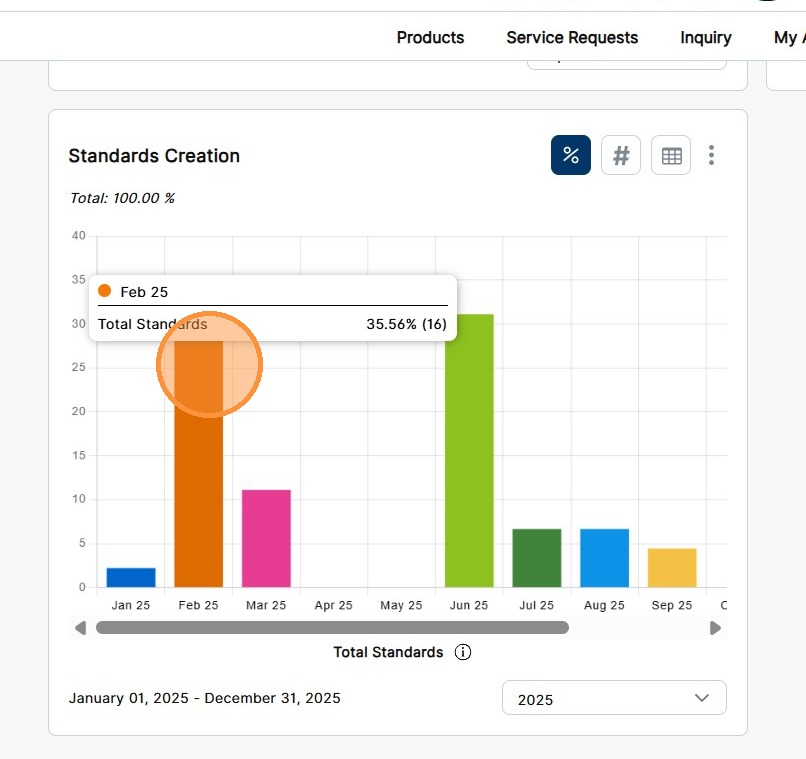
There are different views available on the graph.
Observe the toggle views:
- % – Percentage distribution, based on total number of Standards. Identifies the percentage of the number of Standards created per Month against total number of Standards created in the selected date range.
- # – Number of Standards. Identifies the number of Standards created per Month.
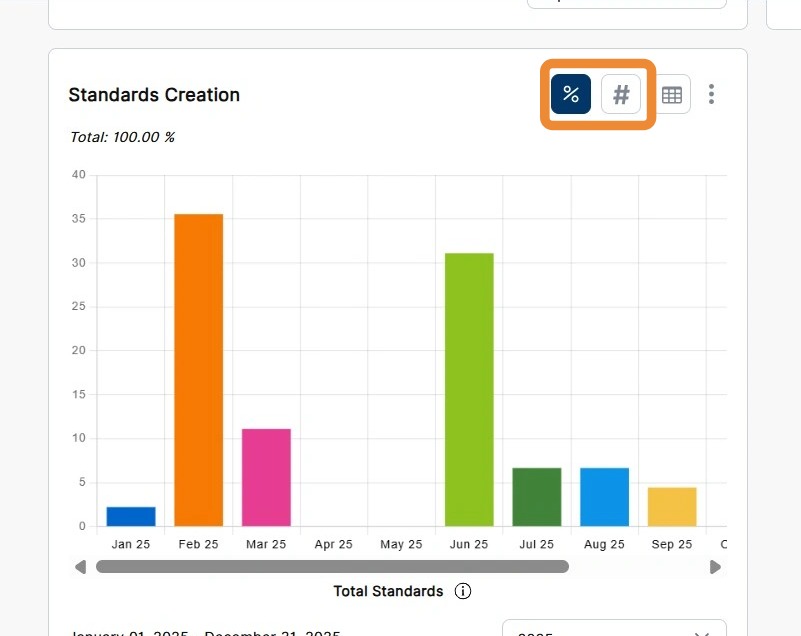
4. To view details for additional Months, click and drag the horizontal scroll bar.
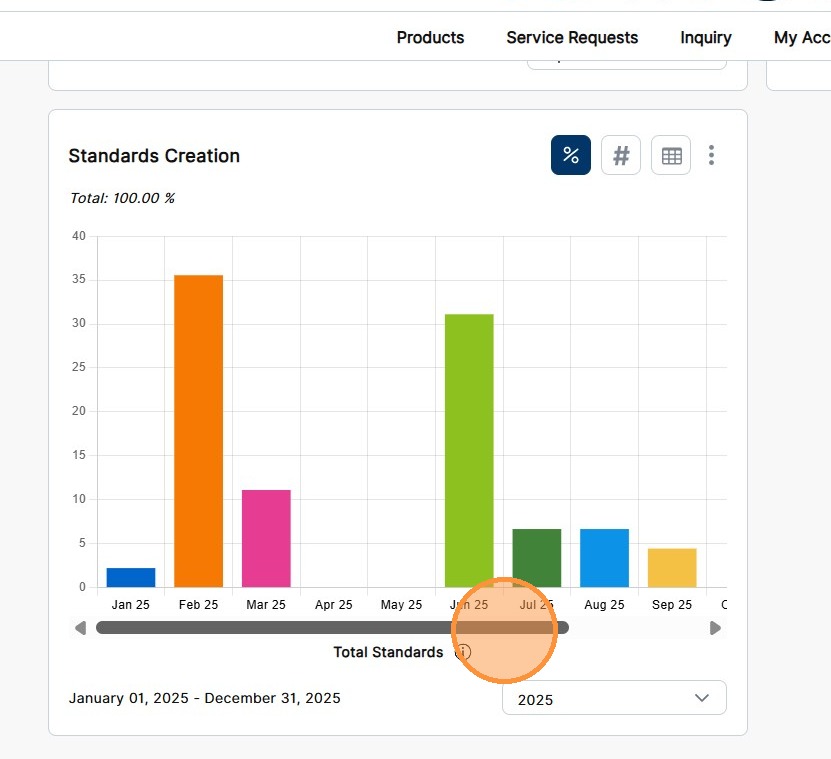
5. To modify the date range for the report, click the Date Range dropdown.
Note: By default, the report loads with all data in the current year to date.
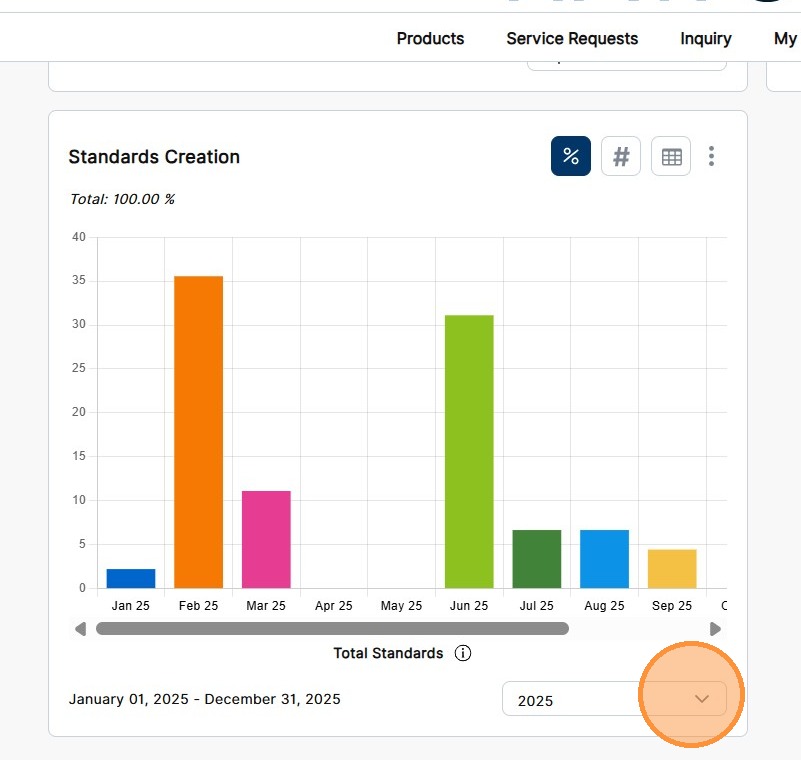
6. Select the desired year, or, to select custom dates, click Custom Date Range .
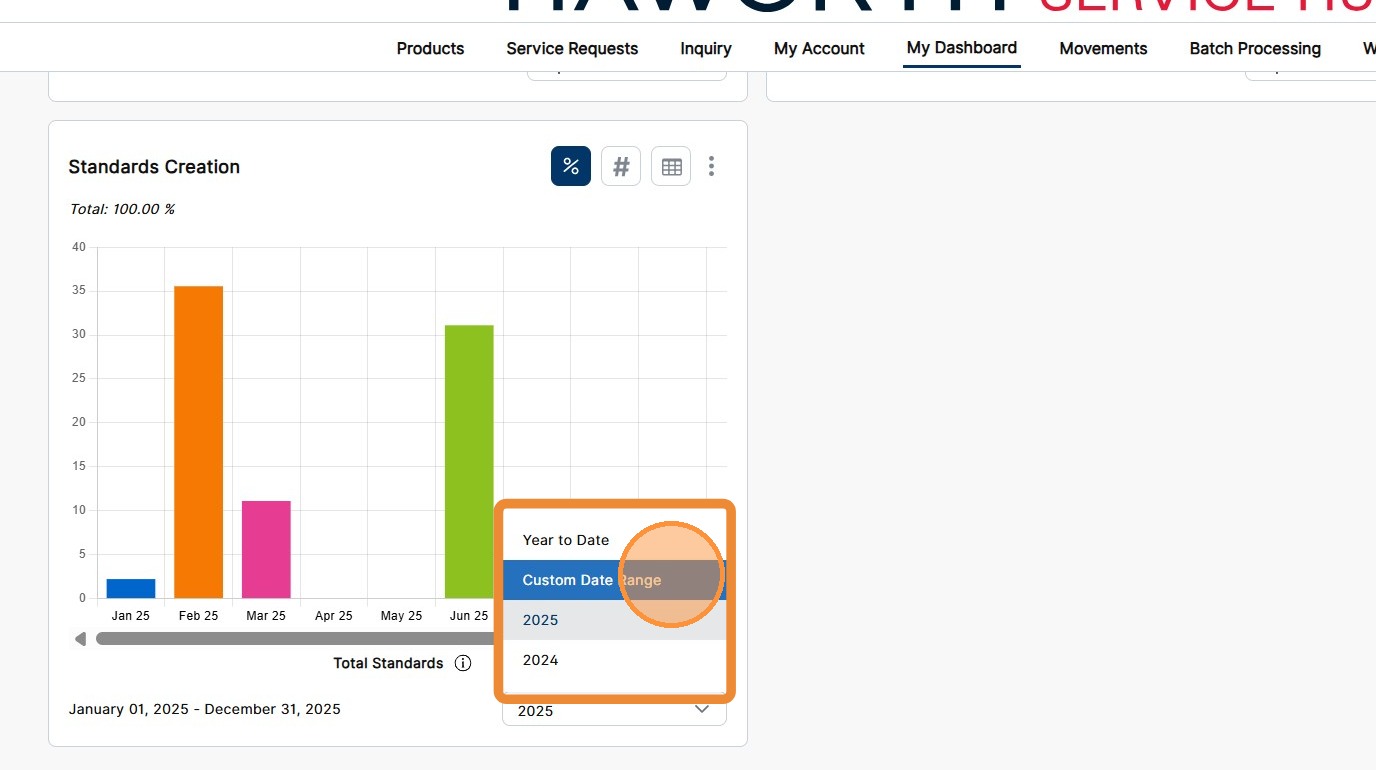
If you select Custom Date Range, the Custom Date Range pop-up displays.
Note: The current dates used in the report pre-populate the From and To date fields.
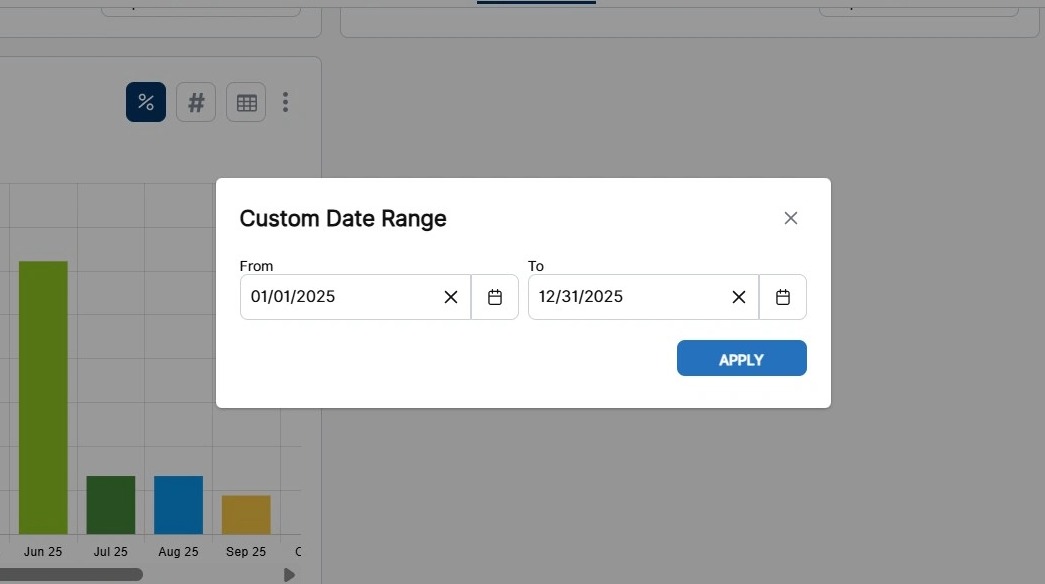
7. To select a custom date range, enter the desired From and To date in the respective fields.
Click Apply.
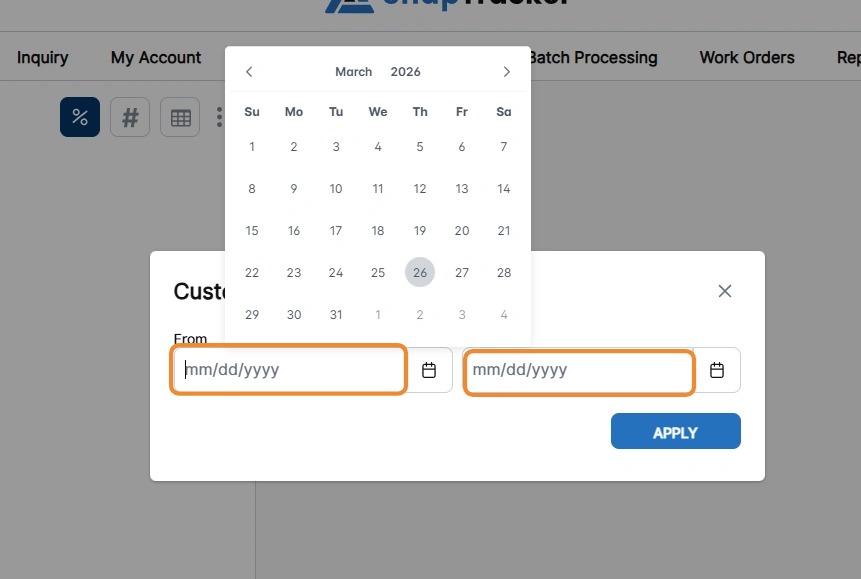
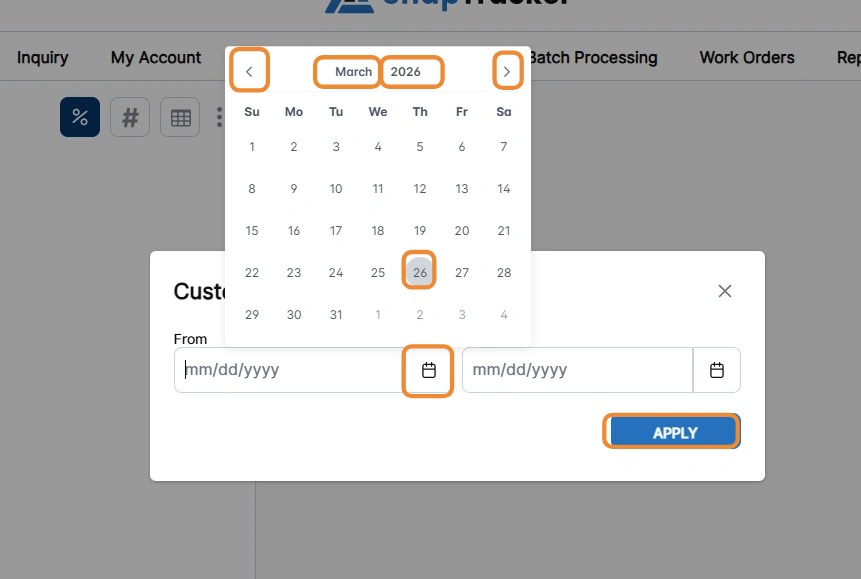
8. Alternatively, click the calendar icon to open the calendar pop-up beside the From and To date field.
Use the navigational arrows to browse through months, or click the Month or Year, and select the desired date.
Click Apply.
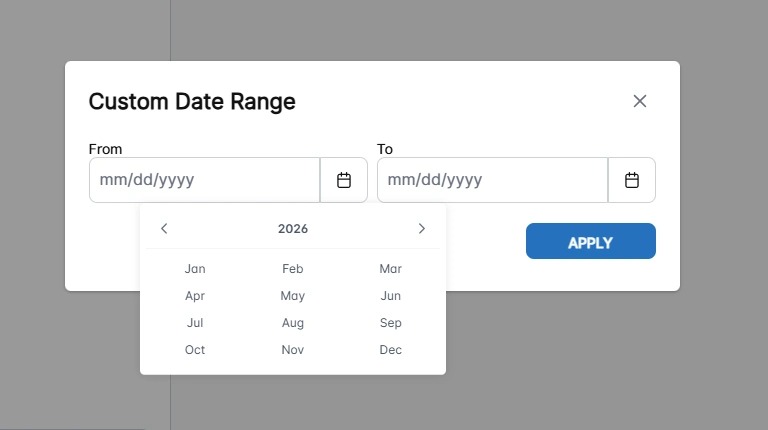
When selecting a Month or a Year from the calendar pop-up, a secondary calendar pop-up displays to quickly jump to the desired time period.
Clicking the Year displays all years within a 10 year range to jump to.
Clicking the Month displays all months within a given year to jump to.
Select the desired Year then Month to drill down to choose a specific date.
The report updates with month details from the selected date range.
9. To see the details within a Month, click the bar of the desired Month.
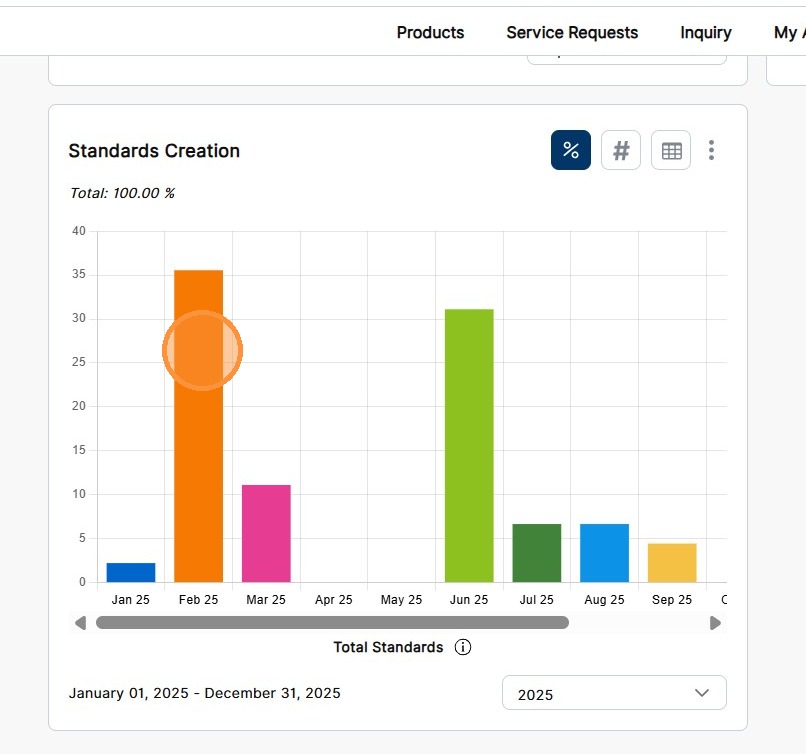
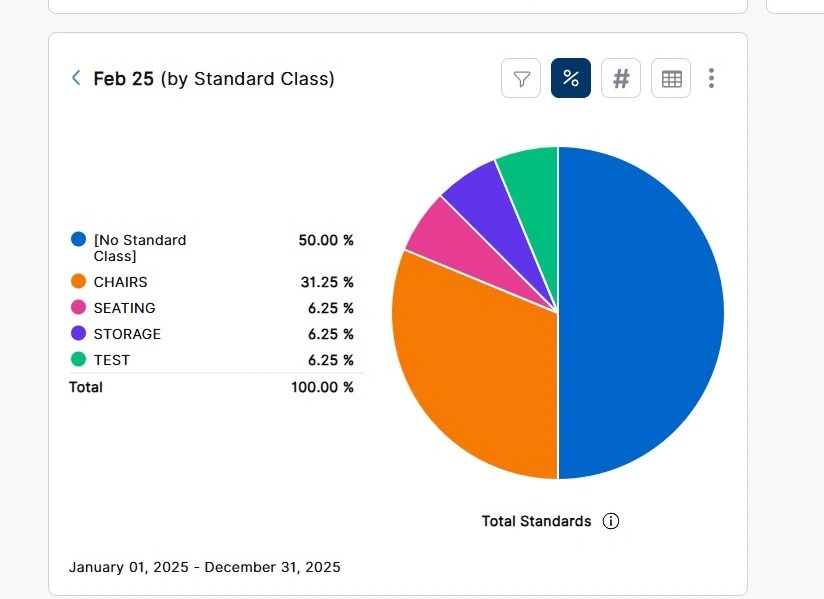
The graph updates with the secondary level of the report, showing a breakdown of the Standard Classes for the Standards created within a Month.
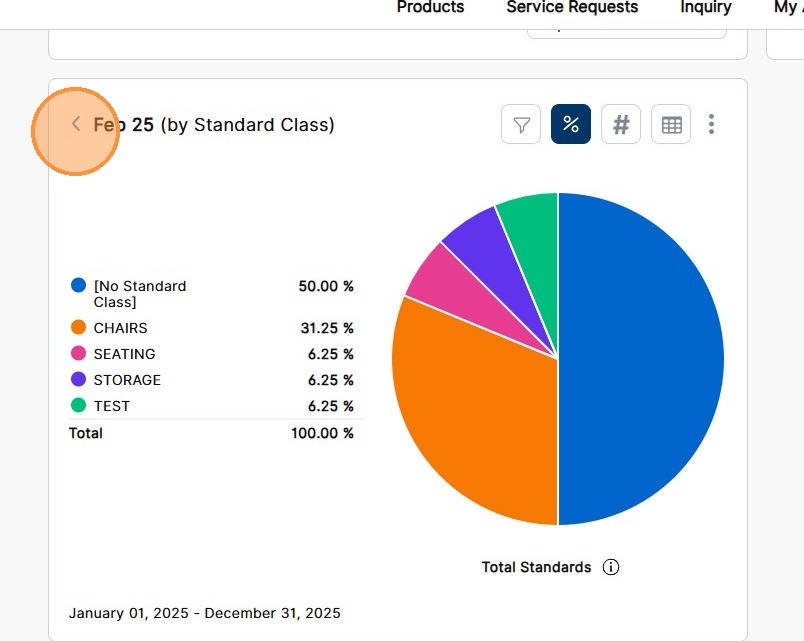
10. To navigate back to the previous report level, click the arrow icon beside the title.
11. To filter the results, click the Filter icon and select the filter category desired.
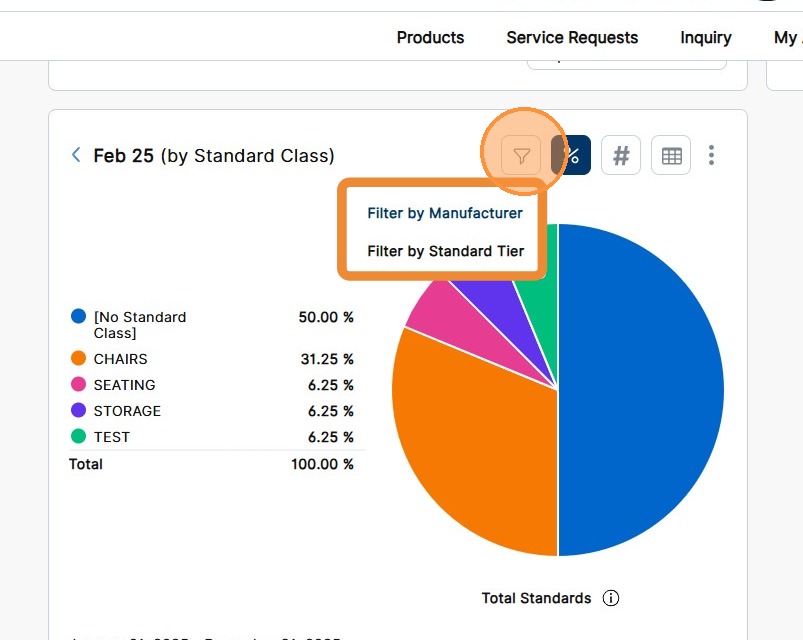
Filter Categories include:
- Filter By Manufacturer – Select the specific Manufacturers you would like to see Standards created for.
- Filter by Standard Tier – Select the Standard Tiers you would like to see the Standards created for.
Note: The options that display in the filters are based on the chart results.
12. Select the checkbox(es) for the desired filter options and click Apply Filter.
To close the pop-up, click Cancel or X.
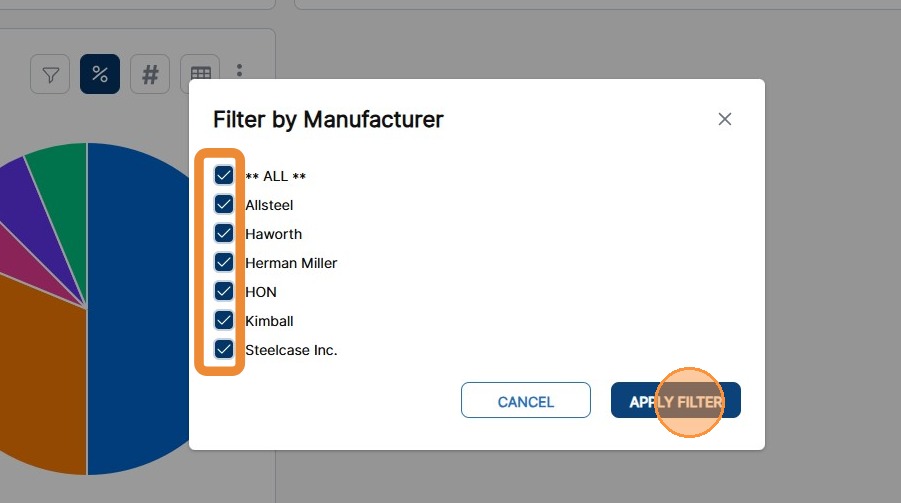
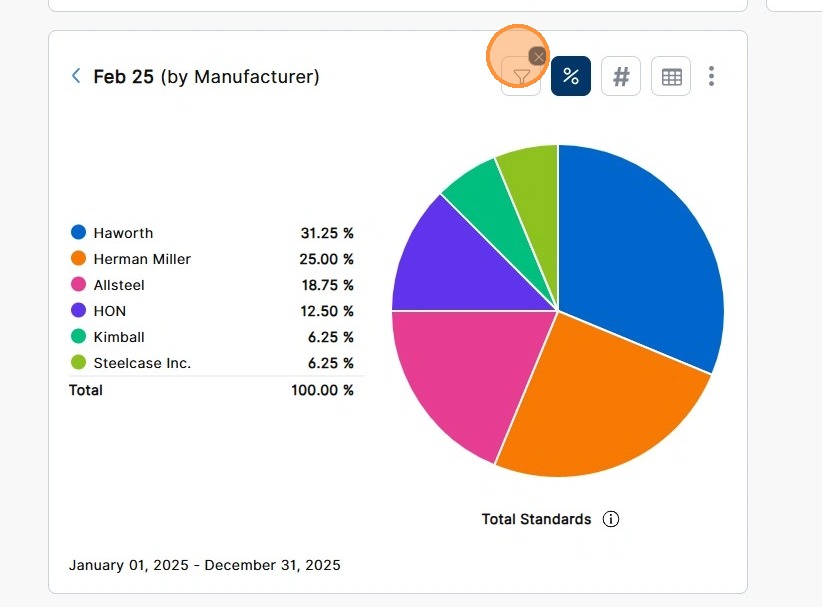
The graph updates to show the results based on the selected filter.
To clear filters, click X on top of the filter icon.
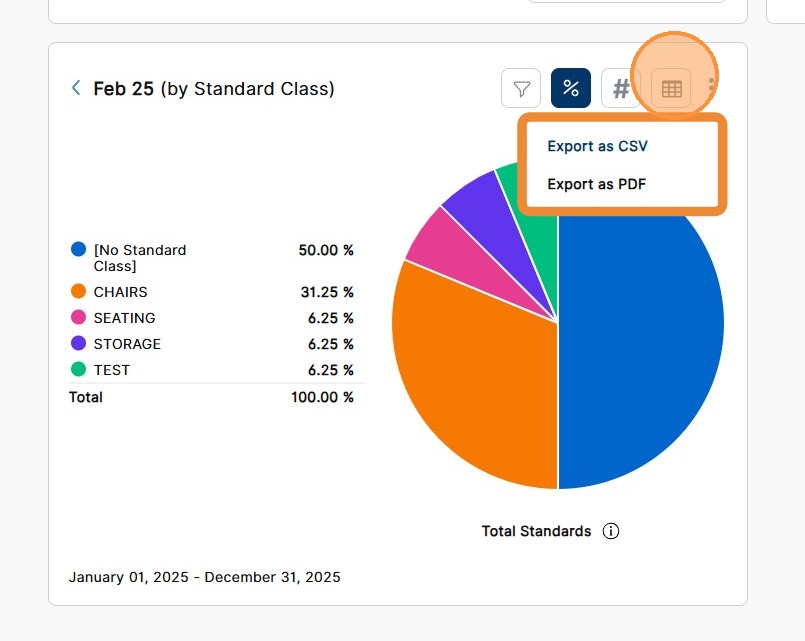
13. To export the report data as a CSV file, go to the desired report level in Chart view and click the ellipses icon.
Click Export as CSV.
Note: To export the report in the Table view, click the download icon.
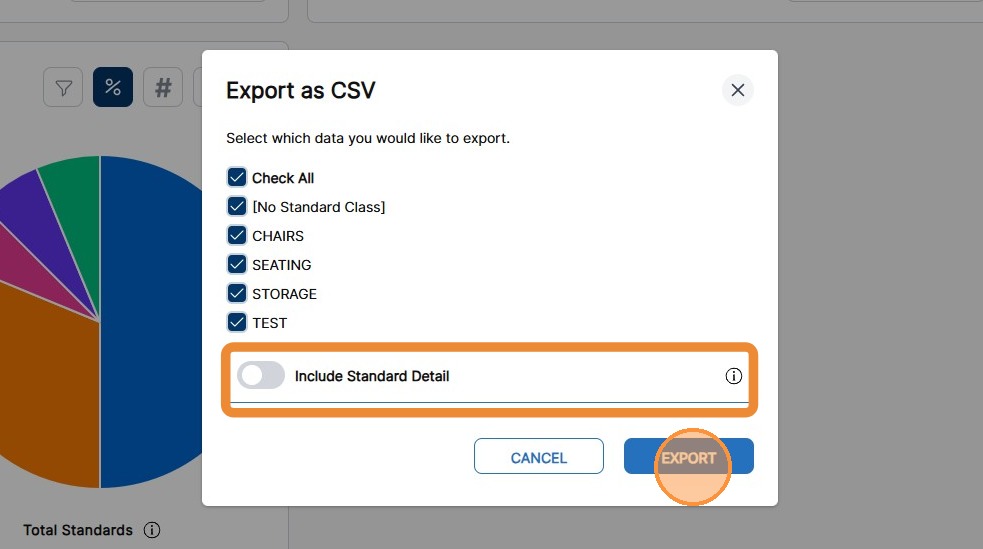
14. In the Export as CSV pop-up, select the checkbox(es) for categories to export and click Export.
Note: If you are on the secondary level of the report, you can decide to export the Standard Details by clicking the Include Standard Detail toggle to ON.
15. To view the Table View of the report, click the Table icon.
Note: The Table icon is available at all levels of the report. The results displayed vary based on the level you are at when you click the icon.
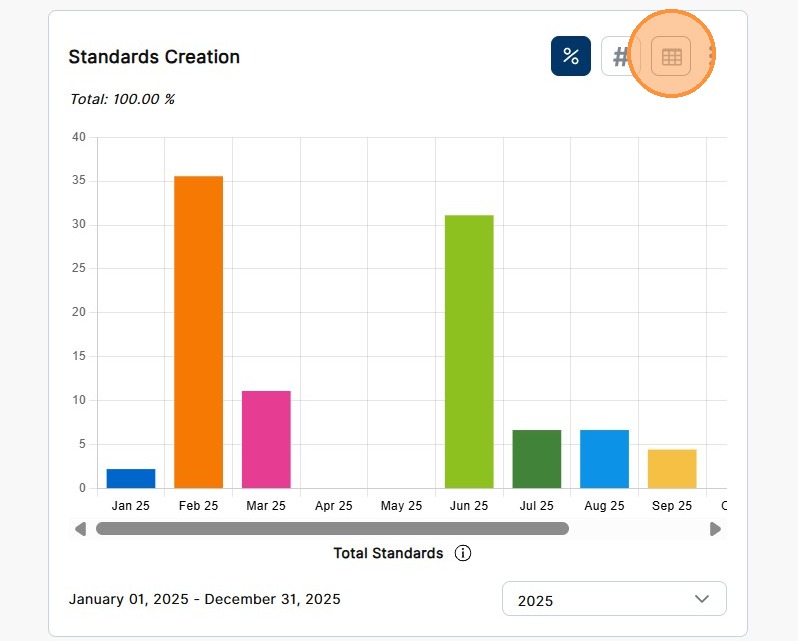
The Table View of the report displays.
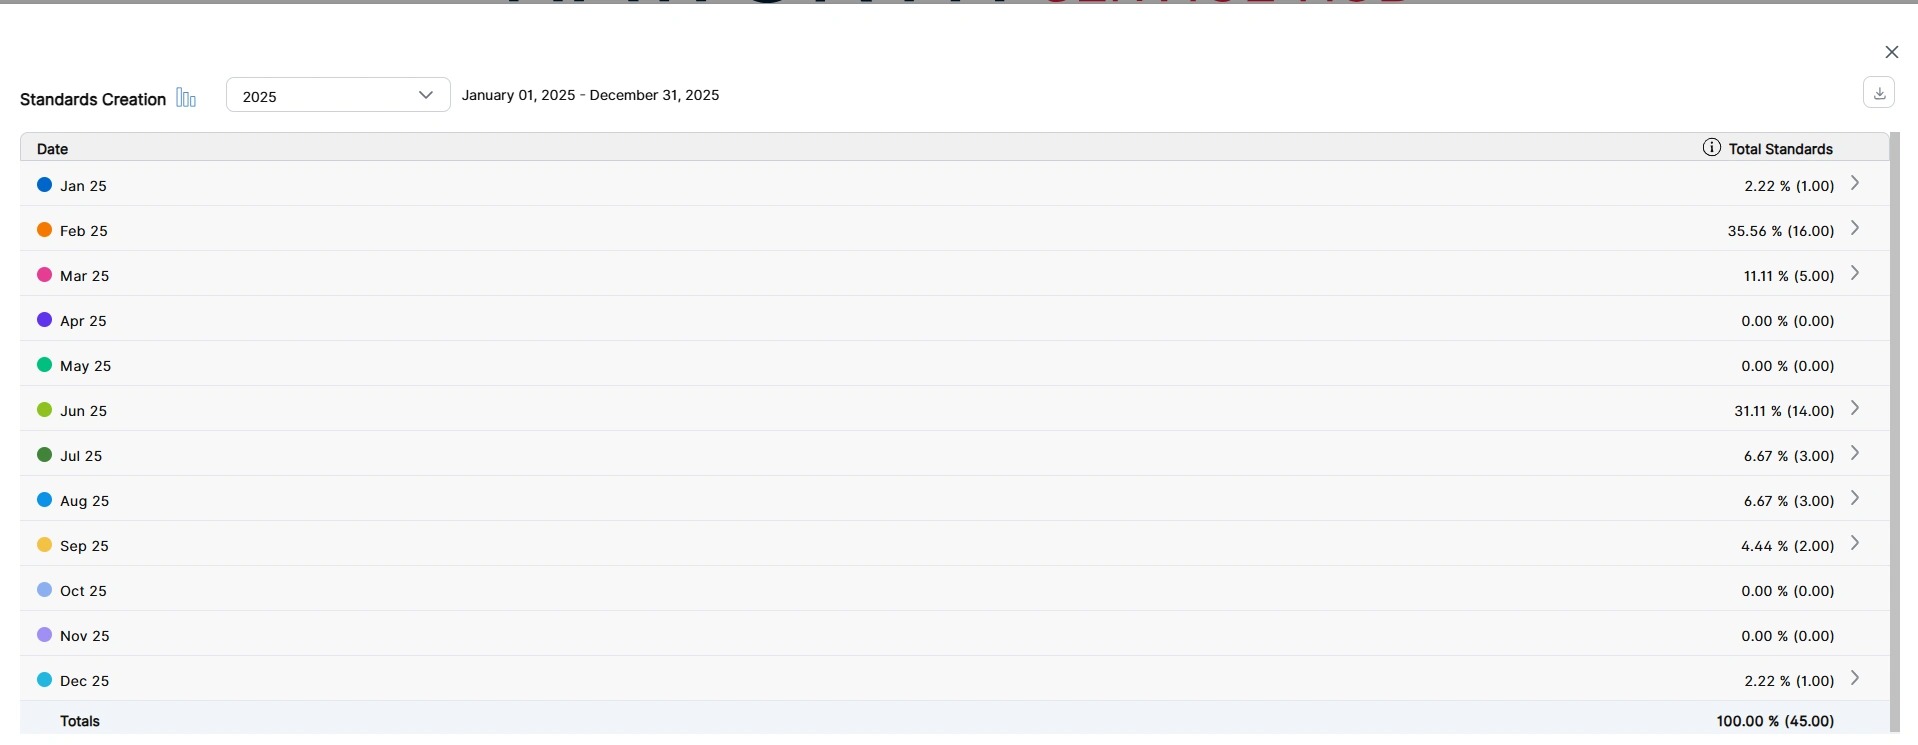
Observe the top level of the Standards Creation Report in the Table View:
- Date – The Month and Year for Standards created.
- Total Standards – The total number of Standards created in a given month and its percentage of the total Standards created in a given date range.
16. To view additional details for a specific Month in the Table View, click the row for the desired Month.
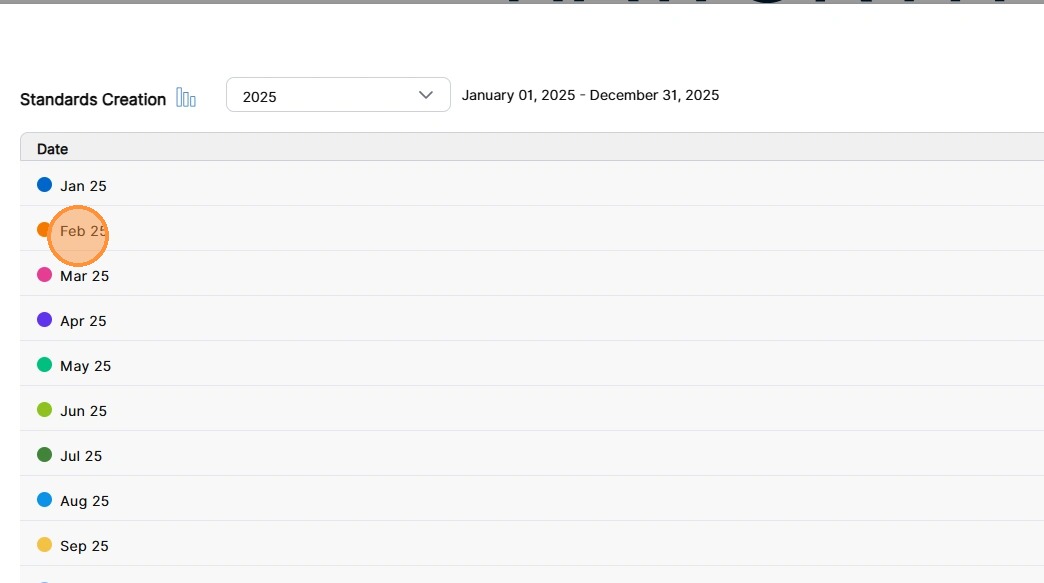
The secondary level of the report displays, showing a breakdown of all Standard Classes with Standards created in the selected month.
Note: The first Standard Class expands by default when accessing this view.
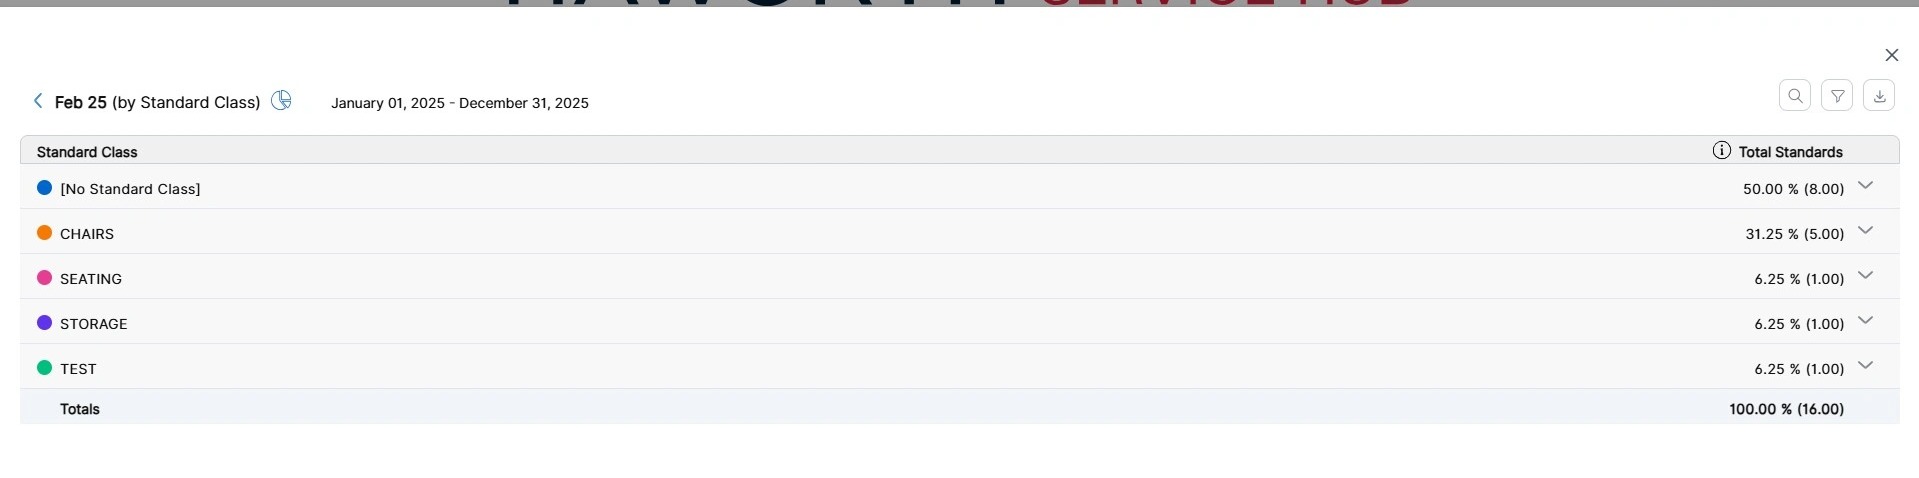
Observe the Standard Class information:
- Standard Class – The Standard Class assigned to the Standards.
- Total Standards – The total number of Standards created in a Standard Class and its percentage of the total Standards created in a Month.
17. Alternatively, you can access the secondary level of the report from the Chart View by clicking the circle icon beside the desired Standard Class.
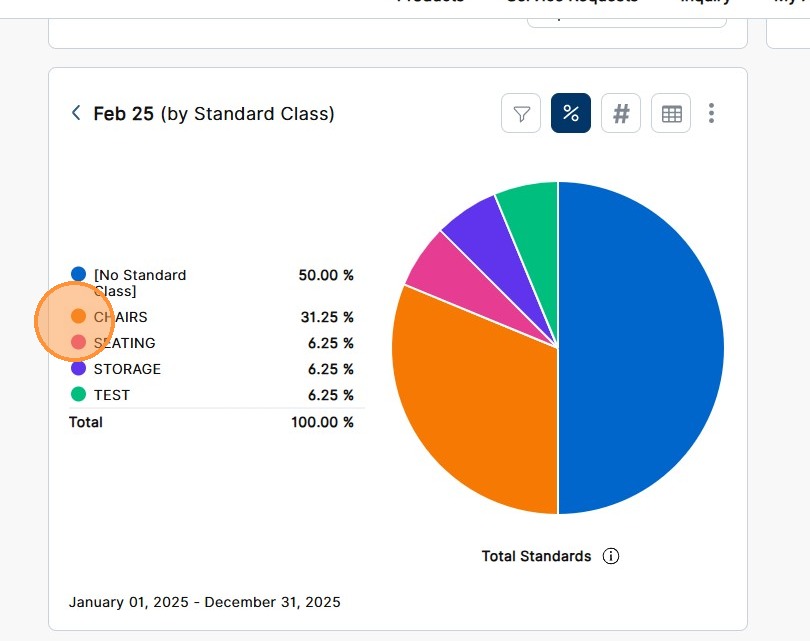
The secondary level of the report displays in Table View, with the selected Standard Class expanded showing Standard details.
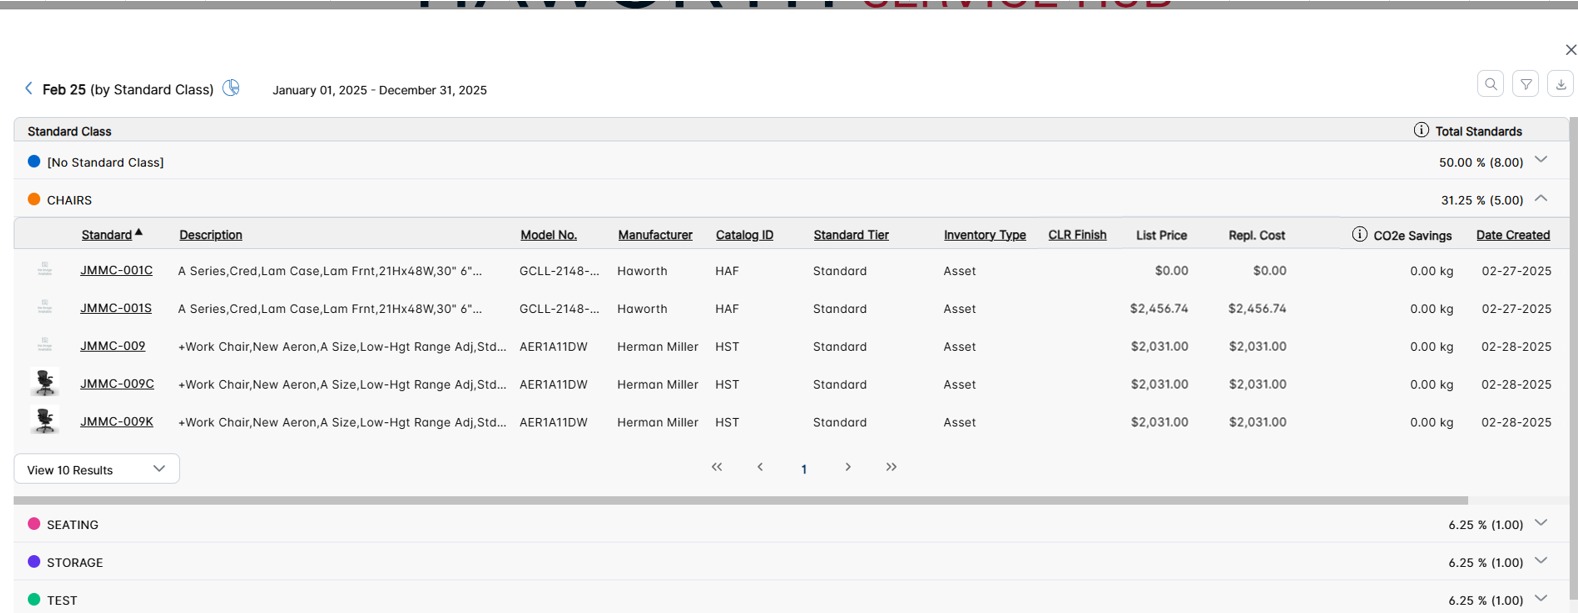
Observe the Standard Details table information:
- Standard – The unique Standard identifier.
- Description – The Standard Description.
- Model No – The Standard’s Model Number.
- Manufacturer – The manufacturer of the product.
- Catalog ID – The Catalog ID assigned to the Standard. Catalog ID is the Manufacturer’s prefix for their different product lines or catalogs.
- Standard Tier – The Standard Tier of the product.
- Inventory Type – The Inventory Type of the product.
- CLR Finish – The color finish of the product.
- List Price – The list price of the Standard.
- Repl. Cost – The per unit Replacement Cost of the Standard, based on the Standard Default Purchase Price.
- CO2e Savings – The potential CO2e footprint savings if all items are redeployed from inventory, for a Standard.
- Date Created – The date the Standard was created.
18. To view additional details related to a Standard, including a larger image, click a hyperlinked Standard.
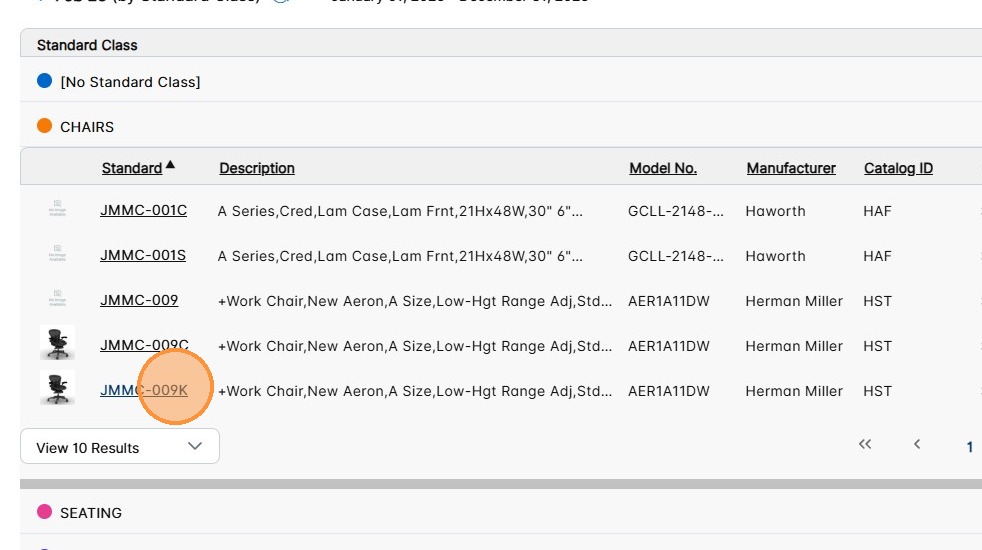
The Quick View side panel displays.
In addition to seeing larger images, different views and other details of the product from the Quick View side panel, you have the ability to add product to a cart (based on user settings).
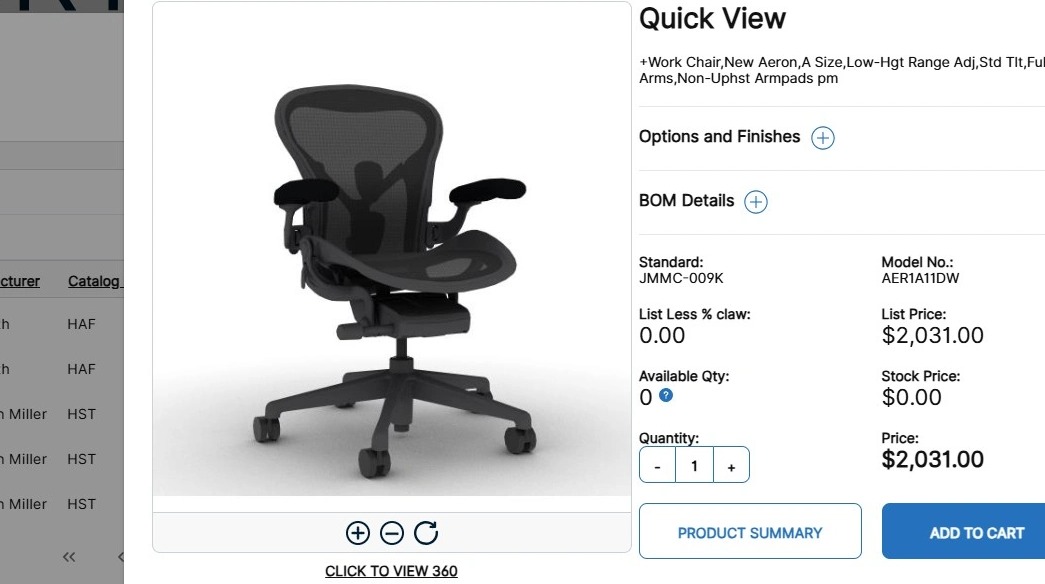
19. To add the selected product to a cart, modify the quantity if desired and click Add to Cart.
Note: Depending on how a Customer is set up, the allocation of product based on Condition may be available. If this is an option, you must click the Select Condition function to specify the product by Condition.
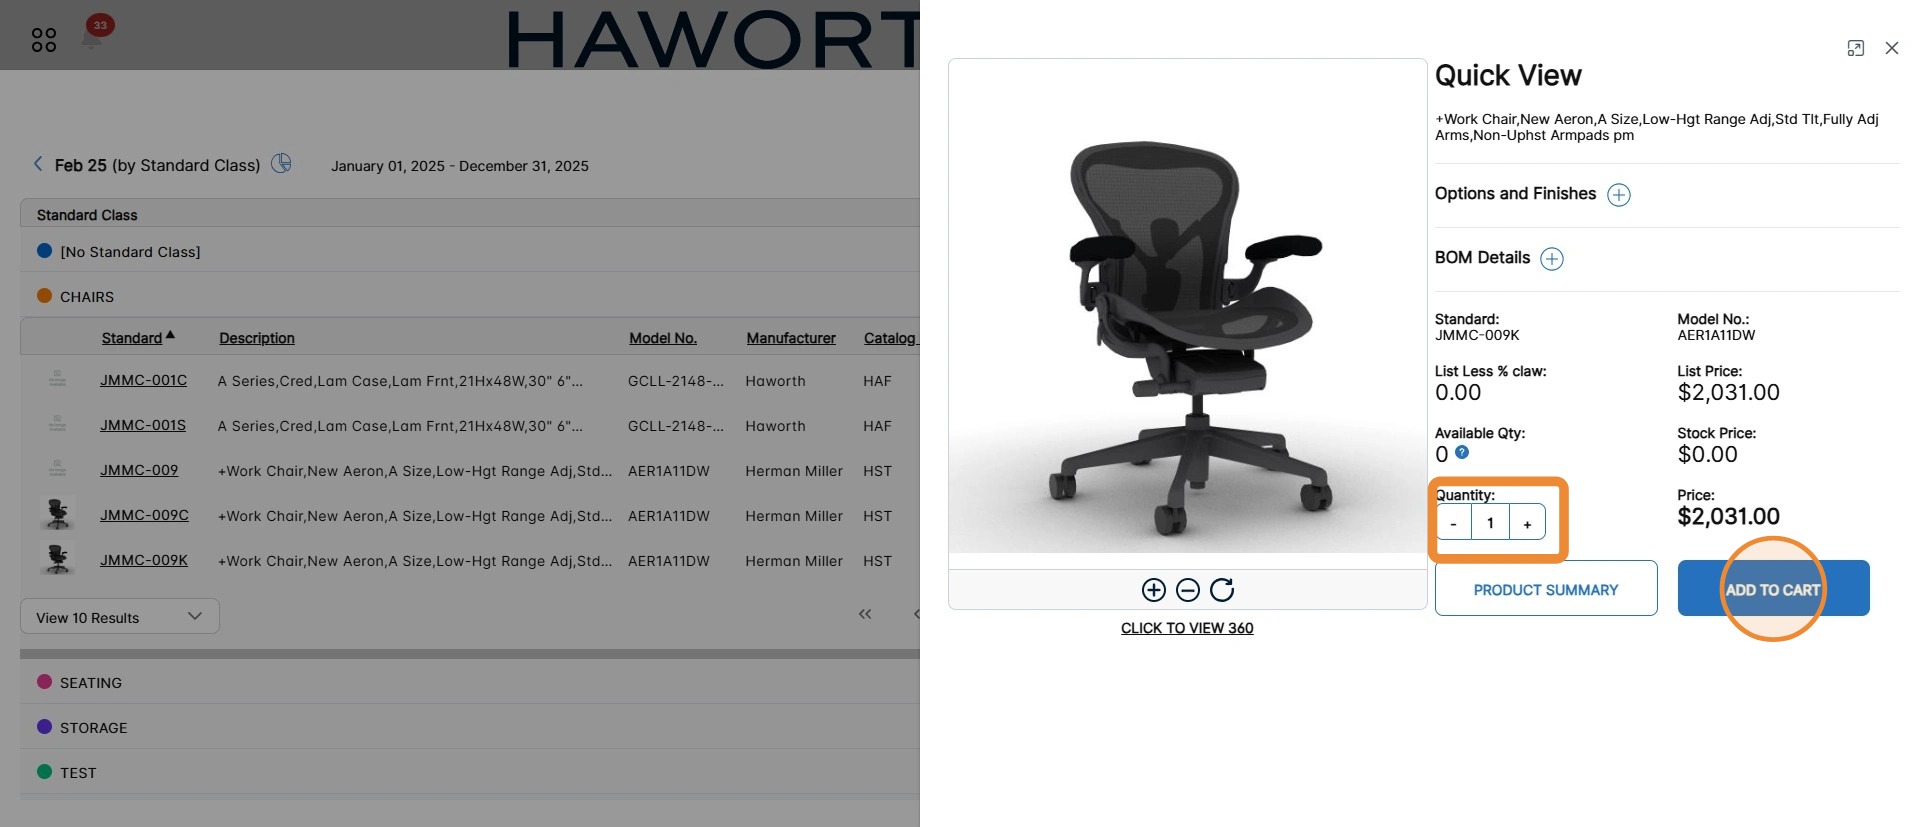
To close the Quick View side panel, click X.